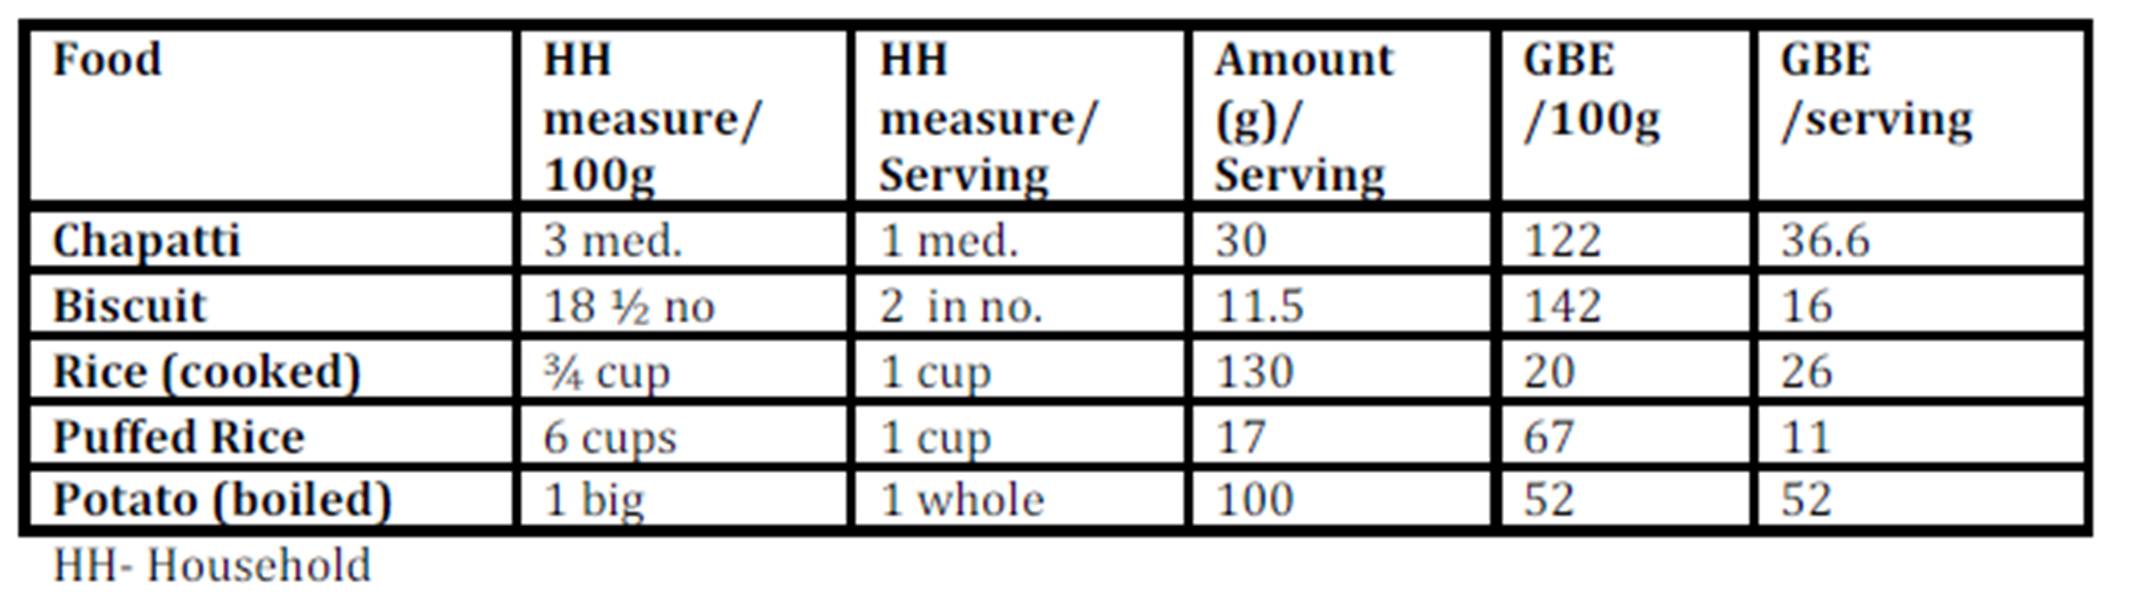
When the predicted glycemic response to common serving sizes of the foods was calculated using GBE/100g values, the picture changed dramatically (Table 3). Potato was found to have the highest GBE/ serving followed by chapatti and rice. Marie biscuit and puffed rice were found to have much lower glycemic response when served as snack item- serving size as compared to 100g portion.
The serving size of staple food like rice or chapatti will never be equal to serving size of biscuit or puffed rice, usually consumed in lower quantity as snack item. Therefore, equi-quantity based comparison is more relevant to items belonging to the same food group, but may not be useful for the comparison among different food groups. In such case, one more terminology as GBE/SS (serving size) can be used to compare the food among different food groups, and will be useful for creating food exchange list within the same food group.
Discussion
When the GBE values for common serving sizes relevant to the test foods were calculated, the quality based relation of food with quantity emerged (Table 3). The moisture content of the selected foods strongly influenced the total amount (volume) of energy nutrient consumed at one time.
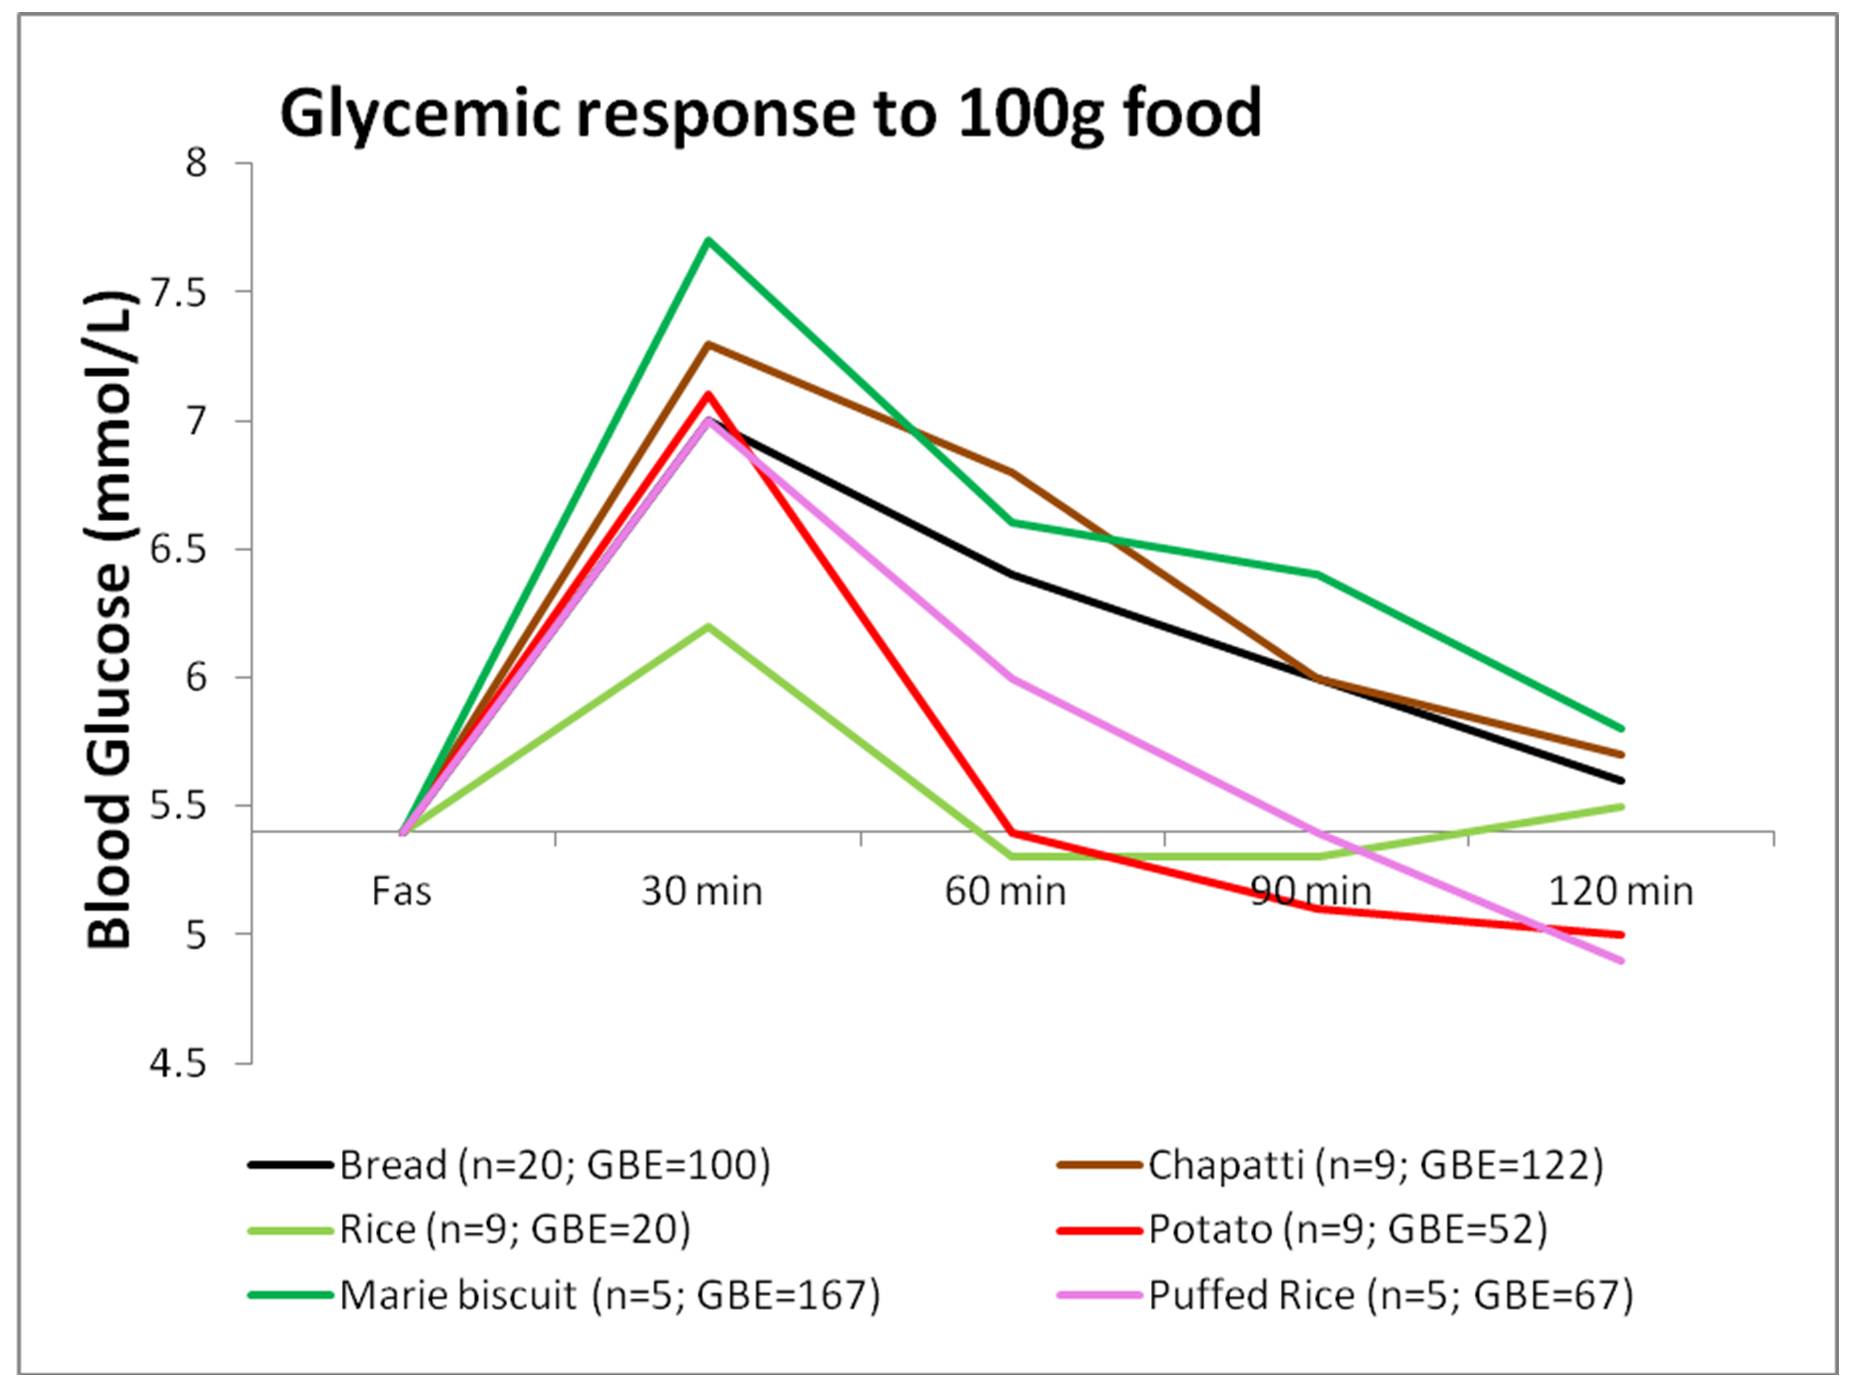
Rice (100g / 3/4th cup), having high Glycemic Index (Miller, Pang, & Bramall 1992), would be expected to induce a higher glycemic response, but its response is equivalent to that induced by 20g bread only; much lower than that of biscuit and chapatti (Figure 1). This is mainly due to the high water content of cooked rice and type of starch present (SenRay & Singhania 2011)
The postprandial glycemic AUC of 100g potato was found to be much lower than that of the same quantity of other test foods (Figure 1). Starch granules of potato absorb large volume of water and swell, leading to increased surface area for action of amylase enzyme. So, the presence of higher amylopectin starch and faster enzyme action is responsible for rapid breakdown and utilization of potato starch, resulting in a less prolonged glycemic response, which, combined with higher moisture content of potato gave a smaller postprandial AUC (Singhania & SenRay 2012a).
Chapatti and Biscuit constitute products made from wheat. The composition of wheat starch includes higher proportion of amylose (25%) chains leading to the slow and sustained release of blood glucose in postprandial period. However, the higher fiber and protein content of the whole wheat flour makes it a better choice than biscuit which is made from refined wheat flour (Singhania & Senray 2012b). 100g Marie biscuit induced significantly higher glycemic response than the same amount of bread (p<0.01), rice (p<0.01), puffed rice (p<0.01) and potato (p<0.01).
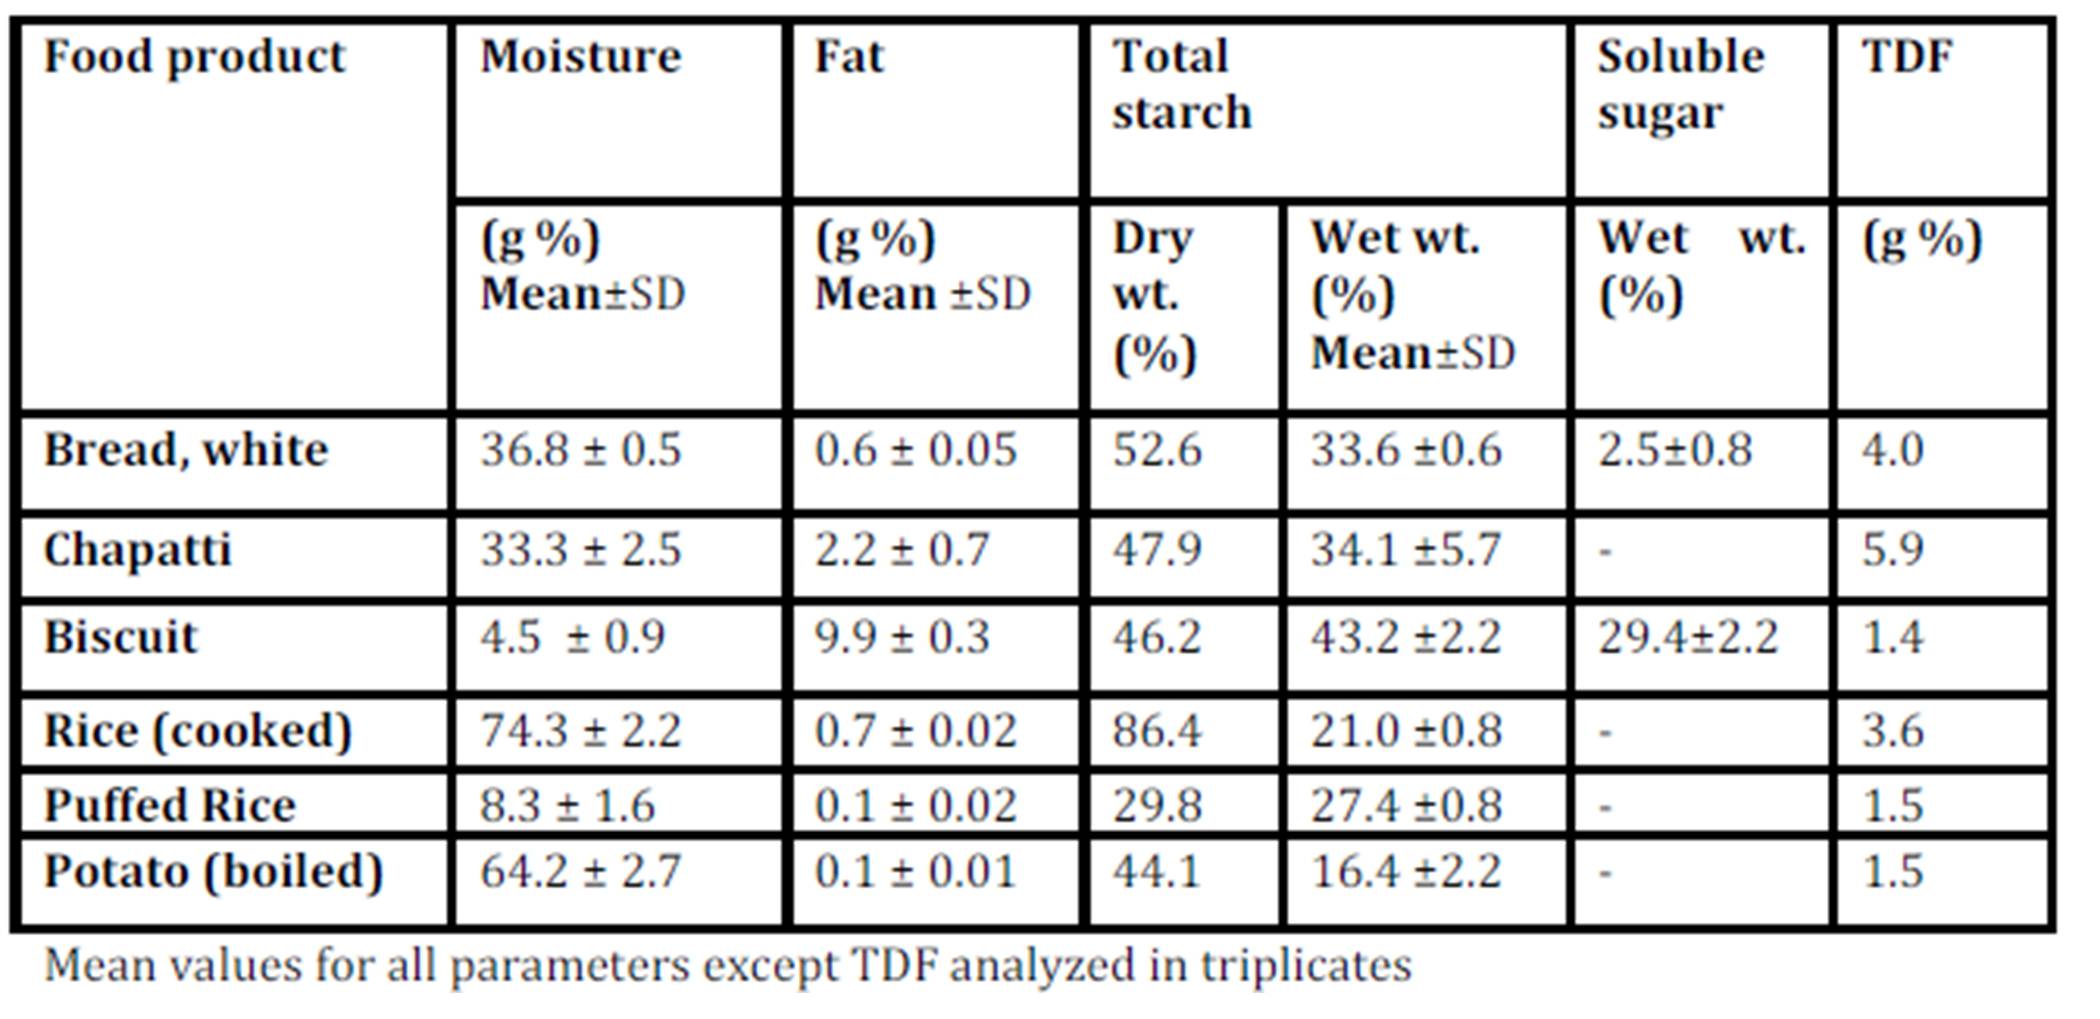
Biscuit contains high amount of starch due to very low moisture content of final crispy product. Free sugars in biscuits add to the hyperglycaemic an effect of the higher starch content. It contains a least amount of fiber and a highest amount of fat (Table 2) as compared to the other test foods, making it a poor choice for obese, as well as for diabetic population. The only consideration is that biscuit is rarely consumed in large quantities (100g) at one time. Here GBE/SS is more relevant since it is eaten as a snack and not as a main dish.
Foods with high volume: weight ratio such as biscuit and puffed rice, have light and porous nature and are generally consumed in lesser quantities at one time. But most often, doctors and nutritionist encourage the consumption of these snacks to patients for their apparent lightness. The high postprandial glycemic impact of these foods on equi-quantity basis indicates a possible negative metabolic impact of consuming them freely. Using GBE/SS, the present study shows that it is permissible to enjoy a limited serving of these snacks (Table 3) without over indulging. Equi-quantity based comparison (GBE) which has much more advantages over the use of traditional GI values, can be used for predicting responses to normal serving size of the products.
Rice and potato being high moisture containing product have high volume and hence, give bulk and satiety with comparatively diluted energy supply, which is the main focus in dietary management of obese individual and other metabolically imbalanced individual. Rice is a staple food eaten with accompaniments. Due to a lower fiber content and poor overall nutritive value, the ideal accompaniments may be foods with higher micronutrient density, such as pulses or vegetables which can attenuate the peaks in glycemic response further (Singhania & Senray 2012c).
Like white rice, chapatti is also a common staple item consumed with accompaniments such as vegetables and pulses. For decades now, chapatti prepared from whole wheat flour has been given preference over white rice. Doctors and nutritionists have advised patients that rice contains only starch and is fattening. Study results show that the predicted glycemic response to regular serving size of chapatti (30g) is much higher than that of rice (Table 3). Also, the normal serving size of one chapatti may not satiate the hunger of an individual but a bowl of white rice can. This emphasizes the importance of bulk and starch density on consumption pattern. There is no doubt that the nutritive value of chapatti by itself continues to be superior to plain rice. But rice, being in the same food group and consumed as the main meal, has lesser postprandial glycemic impact with higher satiety level than the whole wheat chapatti. It appears to be a myth that rice consumption should be restricted strictly for weight watchers or diabetic person; rather it may be a better option than plain wheat chapatti. Sen Ray & Paharia (2013) have shown that rice is favourable as compared to equi-quantity bread even in diabetic individuals having compromised insulin status, due to the lower glycemic and insulinemic impact of cooked rice.
Conclusion
GBE values facilitate the direct comparison of glycemic responses to equal quantities of the whole foods as consumed by the individual. Since the values are expressed in gram units, they can be placed alongside other nutrients in the food exchange list. GBE values for 100g foods can be used to estimate the glycemic response to common serving size or any given doses, unlike the GI. This will enable the consumer to use them while choosing foods based on food quality, as well as quantity in practical situations.
References
1. Arora, S.K.and McFarlane, S.I. (2005) “The case for low carbohydrate diets in diabetes management,” Nutr Metab (Lond),2:16.
Publisher – Google Scholar
2. Beebe, C.A. (1987) “Self blood glucose monitoring: an adjunct to dietary and insulin management of the patient with diabetes,” J Am Diet Assoc, 87:61-65.
Google Scholar
3. Brownlee, M. (2001) “Biochemistry and molecular cell biology of diabetic complications,” Nature , 414:813-20.
Publisher – Google Scholar
4. Ceriello, A., Hanefeld, M., Leiter, L., et al (2004) “Postprandial glucose regulation and diabetic complications,” Arch Intern Med, 164:2090-95
Publisher – Google Scholar
5. Cohen, E.H. (1971) “Rapid technique for solvent removal in the determination of fat,” J Assoc Off Anal Chem , 54:212—214
6. Franz, M.J. (2001) “Carbohydrate and diabetes: is the source or the amount of more importance?,” Curr Diab Rep, 1:177-86.
Publisher – Google Scholar
7. George, M., Rajaram, M., and Shanmugam, E. (2013) “New and Emerging Drug Molecules Against Obesity,” J Cardiovasc Pharmacol Ther., Sep 24. [Epub ahead of print]
8. Khandelwal, S. and Reddy, K.S.(2013), “Eliciting a Policy Response for the Rising Epidemic of Overweight-Obesity in India,” Obes Rev,. Sep 9. doi: 10.1111/obr.12097. [Epub ahead of print]
Publisher – Google Scholar
9. Lane, J.H., Eynon, L. (1923) “Determination of reducing sugars by means of Fehling’s solution with methylene blue as internal indicator,” Journal of the Society of Chemical Industry, 42:32T—37T
10. Lebovitz, H.E. (2001) “Effect of the postprandial state on nontraditional risk factors,” Am J Cardiol ,88(suppl):20H-25H.
Publisher – Google Scholar
11. Mayfield, J., Havas, S. (2005) for the AAFP Panel on Self-Monitoring of Blood Glucose. Self-control: A Physician’s Guide to Blood Glucose Monitoring in the Management of Diabetes. An American Family Physician Monograph. Accessed February 14, 2005.
12. Miller, J.B., Pang, E., and Bramall, L. (1992) “Rice: a high or low glycemic index food?,” American Journal of Clinical Nutrition , 56:1034-6.
Google Scholar
13. Monro, J. A. and Williams, M. (2000) “Concurrent management of postprandial glycaemia and nutrient intake using glycaemic glucose equivalents, food composition data, and computer-assisted meal design,” Asia Pac. J. Clin. Nutr., 9:67-73
Publisher – Google Scholar
14. Monro, J.A. (2005) “Expressing the Glycemic potency of foods,” Proceedings of the Nutrition Society , 64: 115-122.
Publisher – Google Scholar
15. Ranganna, S. (1986) Proximate composition. In: Handbook of analysis and quality control for fruit and vegetable products, 9th edn. Tata McGraw Hill Publishing Company Ltd, New Delhi, p 3, 5,12—15
16. SenRay, K. and Singhania P.R. (2011) “Glycemic and insulinemic responses to carbohydrate rich whole foods,”Journal of Food Science and Technology DOI: 10.1007/s13197-011-0497-7 (in press)
Publisher – Google Scholar
17. Singhania, P.R. & Senray, K. (2012a) “Glycemic response to amylopectin rich starch present in common fasting foods of India,” Nutrition and Food Science, 42(3): 196 — 203
Publisher – Google Scholar
18. Singhania, P.R. and Sen Ray K. (2012b) “Postprandial glycemic and insulin responses to processed foods made from wheat flour,” Int J Diabetes Dev Ctries, 32(4):224—228
Publisher – Google Scholar
19. Singhania, P.R. & Senray, K. (2012c) “Relative glycemic and insulinemic impact of rice and rice products,” Nutrition and Food Science, 42 (4): 231 — 240
Publisher – Google Scholar
20. Sen Ray, K. & Paharia, N.V. (2013) “Equi-Quantity, Equi-Calorie and Dose of Rice on Relative Glycemic and Insulinemic Response in Diabetic Patients,” Open Journal of Endocrine and Metabolic Diseases, 3 (8): 301-307.
Publisher – Google Scholar