Received date: 24 November 2013; Accepted date: 17 February 2014; Published date: 1 October 2015
Academic Editor: Betül B. Baykan
Cite this Article as:
Jacobus F.A. Jansen, Mariëlle C.G. Vlooswijk, Rianne P. Reijs, H.J. Marian Majoie, Paul A.M. Hofman, Albert P. Aldenkamp and Walter H. Backes (2015), "Multimodal MRI Reveals Secondarily Generalized Seizure Related Abnormalities at 1.5 T: Preliminary Findings," JMED Research, Vol. 2015 (2015), Article ID 397761,
DOI: 10.5171/2015.397761
Patients with chronic epilepsy, who have suffered a high number of secondarily generalized tonic-clonic seizures (SGTCS) frequently show cognitive comorbidity. It is yet unclear whether a higher number of SGTCS is associated with tissue changes in the brain. We have investigated in patients with chronic epilepsy whether a high number of SGTCS accumulated over life is associated with microstructural changes in brain tissue. Sixteen patients with localization-related epilepsy with SGTCS underwent a multimodal quantitative Magnetic Resonance (MR) examination at 1.5 T, comprising T2 relaxometry, and diffusion weighted imaging to study microstructural changes in the temporal and frontal lobes. Fourteen healthy volunteers were also included to assess the effect of age. Patients with more than 20 SGTCS (n=8) showed a significantly lower IQ (-20%, p<0.05) compared to those with less than 20 SGTCS (n=8). Furthermore, regional combined multimodal analysis revealed that significant quantitative MRI changes, related to the number of SGTCS, were present in the frontal lobe but not in the temporal lobe. Moreover, the left and right frontal lobe generally displayed lower T2 relaxation times, smaller pericortical cerebrospinal fluid fraction and lower apparent diffusion coefficients, in the patients with more than 20 SGTCS. These findings suggest that SGTCS are associated with substantial changes in microstructural brain tissue characteristics within the frontal lobes. These frontal changes possibly explain the cognitive problems which are often observed in patients with many SGTCS. This knowledge may help in the development of treatment aimed at preventing decline in cognitive abilities.
In patients with persistent seizures, cognitive impairments are the most common comorbid disorder (Blake et al., 2000; Corcoran and Thompson, 1992; Helmstaedter, 2002; Thompson and Corcoran, 1992). The cognitive problems range from memory deficits and mental slowing, to sometimes even global cognitive decline. Also seizures, especially secondarily generalized seizures, might have an effect on cognition. In patients with a high number of secondarily generalized tonic-clonic seizures (SGTCS), cognitive decline has been described (Dodrill, 2002; Dodrill and Batzel, 1986; Stefan and Pauli, 2002; Thompson and Duncan, 2005; Trimble, 1988), although data are sometimes contradictory (Helmstaedter and Elger, 1999; Kramer et al., 2006). In various preclinical and clinical studies, changes in cerebral metabolism (Bernasconi et al., 2002; Jokeit et al., 1997; Miller et al., 2000; Tasch et al., 1999) and neuronal loss (Kotloski et al., 2002) were observed shortly after SGTCS. In animal models, seizures have been shown to cause changes in protein expression, protein modification, mossy fiber sprouting, and synaptic reorganization (Beck et al., 2000), and cell loss in varying regions of the limbic system due to necrosis and apoptosis (Sass et al., 1992; Sass et al., 1990).
Previously, magnetic resonance imaging (MRI) has been applied to investigate possible macrostructural alterations associated with seizure activity. Quantitative volumetric analyses revealed volume reductions of the hippocampus (Reminger et al., 2004), cerebellum (Hermann et al., 2004), and whole cerebrum (Hermann et al., 2003). Furthermore, it was shown that temporal lobe epilepsy patients with frequent SGTCS have lower hippocampal N-acetyl-aspartate to creatine ratios (indicative of decreased neuronal integrity) than patients without SGTCS (Bernasconi et al., 2002; Lee et al., 2005). These observations raise the question whether SGTCS are also associated with micro-structural changes in the brain. The population of patients with epilepsy who suffer from SGTCS is clinically heterogeneous with varying etiologies and seizure characteristics. Furthermore, in contrast to evident acute SGTCS-induced effects, chronic SGTCS-induced effects are expectedly more subtle due to the plasticity and adaptive capacities of the brain. Therefore, to detect possible subtle microstructural effects in an inherently heterogeneous group of patients with localization-related epilepsy and secondarily generalized seizures, we used multimodal quantitative MRI. Comprehending the nature of SGTCS-induced brain abnormalities will contribute to a better pathophysiological understanding of SGTCS, the consequences thereof in general, and may prompt prevention in the future.
In quantitative magnetic resonance (MR) of the human brain, the measured MRI contrasts are converted into physical quantities with metrical units (Tofts, 2003). Compared to conventional structural MRI, used to visually detect abnormalities of brain tissue, the quantitative MRI techniques used in the present study, namely T2 relaxometry, and diffusion weighted imaging (DWI), may be more sensitive to micro-structural in brain tissue.
We previously showed that high numbers of SGTCS are associated with a drop in intelligence scores and altered prefrontal brain activation (Vlooswijk et al., 2008). In this study, we investigated whether a high number of SGTCS accumulated over life is associated with microstructural changes in brain tissue characteristics in the temporal and frontal lobes, as determined by multimodal quantitative MR.
Materials and Methods
Subjects
The study population included 16 patients (10 women and 6 men; mean age 40 years; range 21-59), as described previously (Jansen et al., 2008b; Vlooswijk et al., 2008). All patients were consecutively included from the outpatient clinic for neurology of the Maastricht University Hospital. Data acquisition was conducted within the guidelines of the local institutional medical ethical committee overseeing human research, and every study participant provided written informed consent. Inclusion criteria for the study were: localization-related epilepsy with secondarily generalized seizures, no history of status epilepticus and no other underlying disease.
The following patient data were collected: age at onset, total number of SGTCS during life-time, partial seizure frequency per month (averaged over the last six months), seizure focus, etiology, and drug load. The total number of SGTCS was calculated according to the patient’s history and seizure diaries. For those patients with relatively low numbers of SGTCS, the exact number of SGTCS could be withdrawn from the patient’s history. For those with relatively high numbers of SGTCS, the number was approximated by taking into account the seizure frequency during subsequent periods, reckoning with changes in seizure frequency (for example: weekly seizures during a few months followed by a period of seizure-freedom). Patients were initially divided into two groups, one group with less than 20 SGTCS (n=8), and one group with more than 20 SGTCS (n=8). This threshold value of 20 SGTCS was varied to investigate its influence on the results. Drug load was calculated by standardizing the doses of antiepileptic drugs using the ratio of prescribed daily dose to defined daily dose (Lammers et al., 1995). No SGTCS were reported in the last two weeks before MRI-scanning. Additionally, no partial seizures were reported in the four days prior to the MRI examination. Patient characteristics are listed in table 1.
Table 1: Patient Demographics and Characteristics
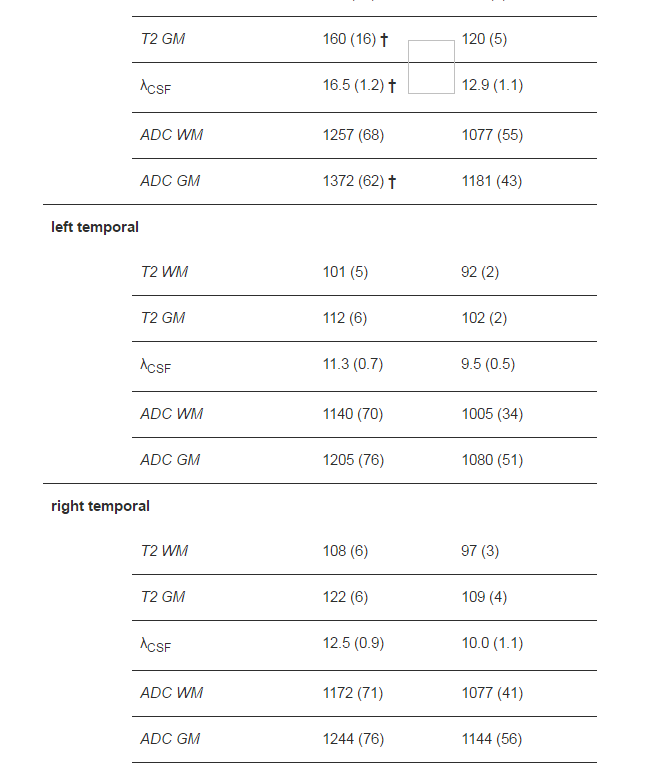
SGTCS, secondarily generalized tonic-clonic seizures; F, female; M, male; LF, left frontal; RF, right frontal; LT, left temporal; RT, right temporal; CD, cortical dysplasia; PT, posttraumatic lesion; MTS, mesiotemporal sclerosis; crypt, cryptogenic; APS, anti-phospholipid syndrome; LTL, left temporal lobectomy; AC, arachnoid cyst; SEM, standard error of the mean.
* Based on the electroencephalogram
Additionally, fourteen healthy subjects (8 women and 6 men; mean age 35 years; range 21-60) were assessed using the identical quantitative MRI protocol to investigate possible age related effects.
Statistical analyses were performed in SPSS (Release 12.0.1 for Windows, Chicago, SPSS Inc.). Clinical parameters were tested using (two-tailed) two-samples Student’s t-tests.
MR Imaging
The whole cerebrum imaging was performed with a clinical 1.5 T MRI system (Philips Intera, Philips Medical Systems, Best, The Netherlands), which was equipped with a standard quadrupolar head receiver coil. For anatomic reference, first a T1-weigthed three-dimensional (3D) fast field echo (FFE) was acquired with the following parameters: repetition time (TR) 11.07 ms, echo time (TE) 3.5 ms, flip angle 90°, matrix 256x256x168, field of view (FOV) 256x130x168 mm3, 1 mm adjacent transverse slices. Additionally, a fluid attenuated inversion recovery (FLAIR) sequence was acquired with the following parameters: TR 5946.76 ms, TE 150 ms, inversion time 2000 ms, flip angle 90°, matrix 256x208x24, FOV 230x172x120 mm3, 5 mm adjacent transverse slices. For T2 quantification a multislice dual-echo turbo spin echo (TSE-Dual) was performed, using the following parameters: TR 5211 ms, TE1 11.9 ms, TE2 80 ms, matrix 256x256x64, FOV 204x256x112.5 mm3, and 1.6 mm adjacent transverse slices with a gap of 0.16 mm. DWI images were obtained with a quadruple-shot echo planar imaging (EPI) sequence, using the following parameters: b-values 0, 400, 800, and 1200 s/mm2, 3 orthogonal diffusion sensitizing directions, TR 2 cardiac cycles (through cardiac triggering), TE 76 ms, gradient overplus on (efficient gradient sampling using strong gradients), matrix 128x128x28, FOV 230x230x170 mm3, and 5 mm transverse slices with a gap of 1 mm.
Image Analysis
The structural MRI images (T1-weighted, T2-weighted (TE = 80ms) and FLAIR) were visually analyzed for abnormalities by an experienced neuroradiologist. Unless otherwise described, quantitative image processing was performed using customized software in Matlab (The Mathworks, Natick, MA, USA), based on SPM2 software routines (Wellcome Department of Cognitive Neurology, London, UK). Spatial normalization was performed using affine transformation to the T1 and T2 weighted template images.
T2 and Cerebrospinal Fluid Quantification
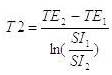
T2. T2 values were calculated (in ms) on a voxel-by-voxel basis using the signal intensities of the images obtained at the two echo times, using the following equation (Woermann et al., 1998):
Where TE1 is the first echo time of 12 ms, and TE2 is the second echo time of 80 ms, SI1 and SI2 are the signal intensities corresponding to TE1 and TE2, respectively.
Cerebrospinal Fluid
A percentile volume cerebrospinal fluid (CSF) map was obtained to assess cerebral atrophy, and to provide information on CSF content of voxels, to exclude CSF-rich voxels in the assessment of quantitative tissue MRI values. It was calculated by attributing voxels individually to a pericortical CSF percentage (λCSF) on a scale of 0-100 %. The λCSF was based on the T2 value of the voxel as calculated from the TSE-dual images. For this, the T2 relaxation rate (i.e. 1/ T2) was assumed to be a fractional volume weighted sum of CSF (T2CSF = 2200 ms (Haacke, 1999)) and uniform brain tissue (T2tissue = 100 ms (Bottomley et al., 1987)): 1/T2 = λCSF / T2CSF + (1- λCSF) / T2tissue. For large T2 values (i.e. T2 ≥ 2200 ms), λCSF was set to 100%. The T2-map was spatially transformed into common coordinates along with the spatial normalization procedure of the TE2 image into the standard brain space defined by the Montreal Neurological Institute (MNI) T2 template. This approach facilitated analysis of various separate brain regions through masks.
ADC Quantification
Maps of the water diffusion in terms of the ADC were calculated by second order polynomial fitting of the direction averaged logarithmic signal intensities versus b-values, according to (Maier et al., 2001; Maier et al., 2004; Tijssen et al., 2009):
Where S is the diffusion weighted signal intensity, S0 the non-weighted intensity,
ADC the apparent diffusion coefficient, b the b-value describing the diffusive motion sensitization by the gradients, and β the coefficient describing the deviation from a monoexponential decay (e.g. due to the presence of water in several different water pool components and the effect of non-Gaussian noise in magnitude images). ADC was expressed in units of 10-6 mm2/s. The ADC-map was spatially normalized along with the normalization procedure of the b=0 image into the space defined by the MNI T2 template.
Data Analysis
As the effect of SGTCS might be different for different cerebral tissue types (e.g. neurons and axons) (Geinisman et al., 1990), we chose to examine grey matter (containing neurons) and white matter (containing axons) separately. To enable a separate analysis of grey matter and white matter, segmentation of the T1-weighted images into grey matter, white matter, and CSF was performed using SPM2. Statistical analysis of the T2-, λCSF-, and ADC-maps was performed on various cerebral regions, using masks created with WFU-Pickatlas (Maldjian et al., 2003). We were only interested in the quantitative T2 and ADC measures of tissue; therefore tissue was
segmented from CSF by applying the threshold lCSF £ 5%. As effects related to SGTCS not necessarily localize to the same microstructural regions from patient to patient, we analyzed data more globally by averaging quantitative MRI outcomes over selected regions, rather than performing a pixel by pixel analysis method. Since the presence of structural and functional brain asymmetry has been reported in morphological studies (Hugdahl, 2000), the left and right hemispheres were analyzed separately. As we previously observed especially frontal and temporal activation abnormalities in this patient group (Vlooswijk et al., 2008), analysis of the imaging data was restricted to the frontal and temporal lobes (see Figure 1). The delineation of the masks was somewhat liberal and mostly larger than the sizes of the regions of interest per individual. By using larger masks, the inclusion of the entire region of interest was assured for every patient, as these sizes may vary throughout the patient population. The mean T2, λCSF, and ADC values were calculated separately for white and grey matter within the selected regions. The mean T2 and ADC values were calculated after discarding the CSF voxels. The liberal sizes of the masks did not affect the mean values notably for the selected regions.
Figure 1: The Employed Frontal (blue) and Temporal (yellow) Masks, Overlaid on Spatially Normalized (a) Transverse, (b) Coronal, and (c) Sagittal T1-weighted MR Images. Slice Positions are Given in Stereotaxic Talairach Coordinates.
Multiple end point testing was controlled for by first investigating in what specific regions quantitative MRI alterations due to SGTCS were found. To this end, λCSF, grey matter T2, and grey matter ADC MRI outcomes were combined per region, since all these measures are substantially affected by changes in water content. For each region, the global null hypothesis stating that no differences exist within that region between the group with less than 20 SGTCS, and the group with more than 20 SGTCS of the included MRI modalities was tested using the ordinary least squares test of O-Brien and Läuter (Läuter, 1996; O’Brien, 1984). In this method, first Z-scores are calculated per MR quantity, these are subsequently added to yield a combined Z-score. For the combined analysis, statistical significance was calculated with two-tailed Student’s t tests with Hochberg correction for multiple comparisons (Hochberg, 1988). Normality of the data was assessed by calculating the skewness.
Additionally, in a subsequent analysis per MRI technique, tissue T2, λCSF, ADC values of the patient group with less than 20 SGTCS were compared with those of patients with more than 20 SGTCS. To investigate the robustness of the chosen threshold of 20 SGTCS, the statistical level of significance was determined as a function of this threshold number. For the separate modality analyses, statistical significance was calculated with two-tailed Student’s t tests. For all statistical analyses, p<0.05 was considered significant. The separate modality analyses were not corrected for multiple comparisons, as these analyses were only performed to obtain overall information on the relative differences in quantitative measures per group, whereas the corrected combined analysis yielded the exact locations of effects. Results were expressed as mean ± standard error of the mean (SEM).
Effect of Age
As the group with more than 20 SGTCS was substantially younger (11 years) than the group with less than 20 SGTCS, we performed an additional separate analysis. For this analysis, the effect of age on quantitative MRI parameters was assessed in a group of healthy volunteers. Processes due to aging in patients with epilepsy can be divided into two categories: the normal natural aging and the epilepsy-related aging. In the latter process, SGTCS are likely to be of a main importance, therefore one cannot correct for pathological aging when the SGTCS are of main interest. However, the effect of (normal) natural aging can be determined by examining healthy volunteers. For the analysis, we included 14 healthy volunteers (range 21 — 60 years) that underwent the same multimodal quantitative MRI protocol. Linear regression was performed to investigate possible age-dependent effects in the quantitative measurements. Linear, rather than a non-linear regression was selected, as the number of healthy volunteers was limited, and more complex models would require more fitting parameters, that might be ‘overfitting’ the data. In this separate analysis, first, all quantitative data from the patients with epilepsy were corrected for age, using the coefficients obtained from these regression analyses. Secondly, the MR results of the two patient groups were statistically compared using these age-corrected quantitative data.
Results
Clinical Characteristics
The patient group with more than 20 SGTCS displayed a significantly higher drug load (+130 %, p<0.05) than patients with less than 20 SGTCS. The age and number of partial seizures were not significantly different between the two groups (p = 0.12, and p=0.39, respectively). Results are shown in Table 2 (Vlooswijk et al., 2008).
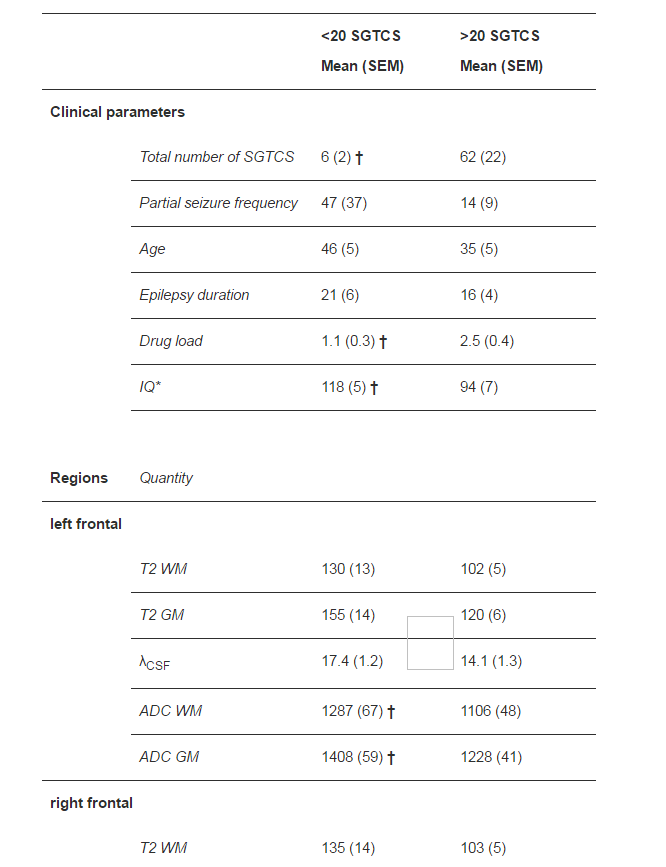
Table 2: Clinical and Quantitative MRI Results in Patients with Less than 20 SGTCS and Patients with More than 20 SGTCS.
SGTCS, secondarily generalized tonic-clonic seizures; SEM, standard error of the mean; Partial seizure frequency (per month); Age (in years); Epilepsy duration (in years) T2, transverse relaxation time (in ms); WM, white matter; GM, grey matter; λCSF, percentage of cerebrospinal fluid (in %); ADC, apparent diffusion coefficient (in 10-6 mm2/s).
* intelligence tested with the Wechsler Intelligence test for Adults III, scores are full-scale IQ.
” 2-tailed P<0.05, ‡ 2-tailed P<0.05 (ordinary least squares test using Hochberg correction)
MRI Quality
Visual inspection of all T2- and ADC- maps did not reveal image artifacts; therefore we were confident that the obtained maps were of good quality (Figure 2). Both patient groups displayed similar MRI quality characteristics.
Figure 2: Spatially Normalized Transverse (a) T1-weighted, (b) Segmented White Matter, (c) Segmented Grey Matter Images, (d) T2-, (e) λCSF-, and (f) ADC-maps of a Patient with Four Secondarily Generalized Tonic-clonic Seizures. Slice Position is z = +14 mm in Stereotaxic Talairach Coordinates.
Neuroradiological Structural MRI Findings
The structural MRI findings of an experienced neuroradiologist, who assessed the T1-weighted, T2-weighted (TE = 80 ms) and FLAIR structural MRI images, are given in table 3.
The skewness of the data was not substantial; therefore, there was no reason to assume that the data were not normally distributed. The ordinary least squares test revealed statistically significant SGTCS-related MRI alterations in both left and right frontal lobe, but not in the temporal lobe. (Table 2).
Threshold
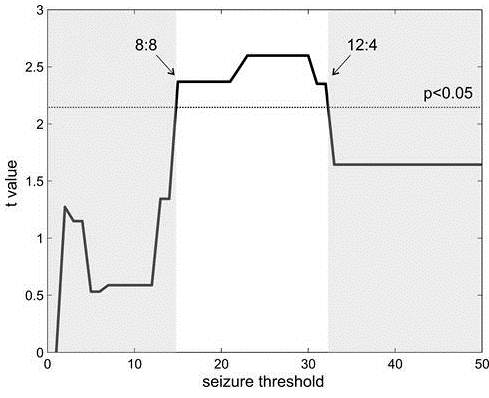
The obtained differences in right frontal combined multimodal measures (λCSF, grey matter T2, and grey matter ADC combined) between two groups (see Table 2) of patients with epilepsy separated based on the number of SGTCS during lifetime were highly robust against considerable variation (range, 15 to 32 SGTCS) in the selected threshold of SGTCS (see Figure 4). It is important to note that above 32 SGTCS, the group with more SGTCS is too small (n=3 or less) leading to insufficient statistical power.
Figure 4: Graph illustrating the robustness of the applied threshold. The black line indicates the t value obtained from a Student’s t test comparing the right frontal combined multimodal measures (λCSF, grey matter T2, and grey matter ADC combined) between the two patients groups separated based on a varying number of SGTCS as a threshold. The area above the dotted line corresponds with statistically significant (p<0.05) t-values. The black line crosses the dotted line at 15 and 32, indicating that the threshold within the range of 15 to 32 SGTCS yields statistically different results. Outside this range, the two groups are not statistically different. The numbers accompanying the arrows indicate the composition in terms of number of patients for both groups. The applied threshold of 20 SGTCS was chosen as this threshold enabled a separation, such that both groups consisted of 8 patients. Above 32 SGTCS, the group with more SGTCS will be too small (n=3 or less) for sufficient statistical power.
T2 Relaxometry
In the right frontal lobe, a significantly decreased (-25%, p<0.05) T2 relaxation time for grey matter was observed in the group with more than 20 SGTCS. Additionally, a significantly decreased cerebrospinal fluid (-22%, p<0.05) content was found in this region.
Diffusion Weighted Imaging
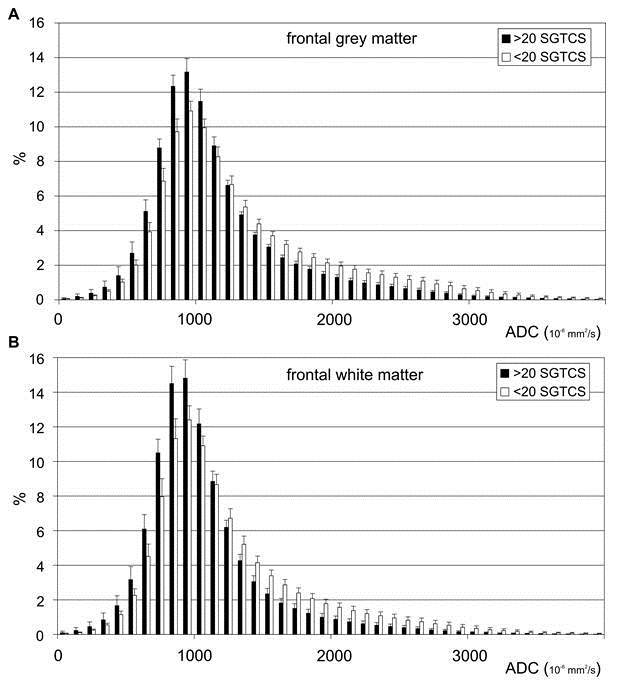
Decreased ADC values in both white (-14%, p<0.05) and grey matter (-13%, p<0.05) of the left frontal lobe were observed in the group with more than 20 SGTCS. Furthermore, a significant decrease in ADC (-14%, p<0.05) was noticed for the grey matter of the right frontal lobe. In Figure 3, the average histogram distribution of the ADC values within the right frontal (4a) grey and (4b) white matter are given for both patient groups. For both grey and white matter, patients with more than 20 SGTCS have a higher frequency of relatively low ADC values (approximately 1000 ×10-6 mm2/s) than patients with less than 20 SGTCS, whereas patients with less than 20 SGTCS have a higher frequency of relatively high ADC values (approximately 2000 ×10-6 mm2/s) than patients with more than 20 SGTCS.
Figure 3: Average histogram distribution plots of ADC values within the right frontal (a) grey and (b) white matter. Patients with more than 20 secondarily generalized tonic-clonic seizures (SGTCS) are indicated with black bars, patients with less than 20 SGTCS with white bars. Note that all voxels with λCSF >5% are excluded from data analysis. Error bars display standard error of the mean.
Effect of Age
Linear regression of quantitative MRI data from the healthy volunteers revealed significant age dependent effects for T2 (+0.8 ms/y, p<0.05), λCSF (+0.12%/y, p<0.05), and ADC (+5 ×10⁻⁶ mm2/sy, p<0.01). A separate, age-corrected analysis of quantitative data from the patients with epilepsy revealed similar results as the analysis without age-correction, e.g. generally decreased frontal T2, λCSF, and ADC values associated with SGTCS (data not shown).
Discussion
In this study, we combined quantitative multimodal MR, comprising T2 relaxometry, and DWI to assess the effect of multiple SGTCS experienced during lifetime on microstructural cerebral tissue characteristics. A number of novel MRI abnormalities were found. Regional combined multimodal analysis revealed that significant quantitative MRI changes were present in the frontal lobe but not in the temporal lobe, which were related to the number of SGTCS. Furthermore, the left and right frontal lobe generally displayed lower T2 relaxation times, smaller pericortical CSF fraction and lower ADC values, in patients with more than 20 SGTCS compared to those with less than 20 SGTCS.
Clinical Characteristics
As described previously (Vlooswijk et al., 2008), patients with more than 20 SGTCS have a lower IQ compared to patients with less than 20 SGTCS. Also, higher drug loads were observed for the patient group with more than 20 SGTCS. These results suggest that patients with a more severe type of epilepsy, with many SGTCS, are receiving more antiepileptic drugs, probably because these patients are more likely to be drug therapy-resistant.
Quantitative MRI: Regional Analysis
The patients included in this study had varying etiologies (see Table 3) and seizure foci. However, the heterogeneous composition of both, the patient group with less than 20 SGTCS and the group with more than 20 SGTCS was highly similar (e.g. both frontal and temporal seizure foci, see Table 1). Both groups consist of two patients with frontal seizure foci, four patients with temporal seizure foci, one with multiple foci and one with unknown origin. Therefore, we argue that the influence of the focus on the observed differences between the two groups is limited, whereas the number of SGTCS is of more importance. The combined regional analysis of quantitative MRI revealed predominantly frontal abnormalities. As the performance of executive functions, e.g. working memory, is of substantial importance for normal cognitive performance (Dikmen and Matthews, 1977), it is possible that, the prefrontal cortex is involved in the mechanisms underlying the observed lower IQ values. Additionally, since the seizure focus for the patients with more than 20 SGTCS was only located in the frontal lobe for two patients (Table 1), the involvement of the frontal lobes for the other patients is possibly due to the secondary generalization of seizures (i.e. spread) (Vlooswijk et al., 2008).
Microstructural MR
Chronic neuronal damage due to seizures is often associated with increased water content, leading to increased pericortical CSF fractions, and T2 and ADC values (Hugg et al., 1999; Jansen et al., 2008a). In this study, however, we very consistently observed the opposite effect: a high number of SGTCS was associated with decreased T2, ADC, and fractional CSF values. A possible explanation for this apparent discrepancy is that most clinical quantitative MRI epilepsy studies were focused on detecting abnormalities at or near the epileptic focus. Our method was primarily aimed at detecting general abnormalities remote from the seizure focus, therefore different mechanisms may be underlying these abnormalities. In a diffusion tensor imaging study of patients with medial temporal lobe epilepsy and hippocampal sclerosis, Thivard et al (Thivard et al., 2005) also observed decreased ADC values in a region distant from the epileptic focus, e.g. the contralateral amygdala and hippocampal region. Although, the exact mechanism underlying this decrease was not known, it was speculated that generalization of seizures could be related to functional changes of neurons and reversible transsynaptic deafferentation (i.e. the elimination of sensory nerve impulses by injuring the sensory nerve fibers) of the contralateral temporal lobe. Moreover, it was hypothesized that the observed abnormalities would be related to neuronal dysfunction, rather than neuronal loss (Thivard et al., 2005). One can only speculate whether this explanation also holds for the SGTCS related frontal abnormalities observed in this study. Moreover, it remains to be elucidated why the frontal lobes rather than the temporal regions seem to be affected. The effect of SGTCS on altered MRI characteristics (i.e. T2 and ADC) was more pronounced in the grey matter than the white matter (Table 2). Apparently, grey matter is more prone to SGTCS related alterations than white matter. We suggest that neurons (predominantly present in grey matter) are more sensitive to SGTCS-related damage than axons (predominantly present in white matter). We therefore hypothesize that, the signal transduction properties of axons are morerobust and less prone to increased neurotransmitter traffic than the signal reception properties of neurons.
Limitations
The current study has some limitations that restrict generalization of SGTCS-related cerebral abnormalities. Due to its cross-sectional design, the limited number and heterogeneous nature of patients, the observed effect cannot be unambiguously attributed to SGTCS alone. Furthermore, the group with more than 20 SGTCS is substantially younger (11 years on average) than the group with less than 20 SGTCS, although this difference is not statistically significant. A possible cause for increased ADC and T2 values could be an increase in CSF fraction due to age-induced atrophy. However, in our analysis all CSF-containing voxels were excluded. Thus, the obtained tissue values are not influenced by alterations in CSF content. Moreover, the separate age corrected analysis yielded similar results as the initial analysis. Also, a study by Bone et al (Bone et al., 2012) showed that in patients with SGTCS, age had an effect on video-EEG features rather than on imaging results. Therefore, we argue for the exclusion of an age effect. Also, a significant difference in drug load between the groups was observed, which indicates that the observed differences might be purely due to higher drug loads. It is very complicated and possibly unethical to study the effect of SGTCS with lower drug load; furthermore, a high drug load is likely an ultimate consequence of the severity of the epilepsy due to the SGTCS. Even, in this small population of patients with varying etiologies and seizure foci, we demonstrate a statistically significant effect of number of SGTCS on frontal abnormalities. Moreover, SGTCS are affecting intellectual functioning and might be an important factor in cognitive decline (Vlooswijk et al., 2010). Possibly, in more homogeneous and larger epilepsy populations, the effects could be even more pronounced. The applied threshold of 20 SGTCS might seem somewhat arbitrary, however we found that, the obtained differences between two groups of patients with epilepsy separated based on the number of SGTCS during lifetime, were highly robust against considerable variation in the selected threshold of SGTCS (see Figure 4).
Clinical Implications
Clinically, it has been proven difficult to substantiate that seizures can cause (permanent) brain damage, which might be responsible for cognitive decline (Vingerhoets, 2006). These days, emerging data exist from human MRI and neuropsychological studies as reviewed by Sutula et.al. (Sutula et al., 2003). Therefore, patients can no longer be reassured with confidence that only prolonged seizures, as in status epilepticus, can cause brain damage and/or intellectual dysfunction, whereas repeated brief seizures do not. The results of the current study suggest that seizure control in patients with epilepsy is of a major importance, as the presence of SGTCS in the human brain is associated with an adverse and widespread neurodevelopmental impact on both brain structure and function.
Conclusions
In the present study, frontal, but not temporal, MRI abnormalities were found to be related to SGTCS. These findings are unique and suggest that SGTCS are associated with substantial changes in microstructural brain tissue characteristics within the frontal lobes. These frontal changes possibly explain the cognitive problems which are often observed in patients with many SGTCS. Future studies on cognitive abilities in chronic epilepsy should reckon with the observation that cerebral tissue abnormalities, which can be detected by quantitative MR techniques, may be a relevant factor. Eventually establishing a relation between cognitive decline and chronic epilepsy may help in the development of treatment aimed at preventing decline in cognitive abilities.
Acknowledgements
The authors express gratitude for the contribution of I.A.M. Westmijse, who participated in the development of the initial data processing routines.