Introduction
Since there are no legal requirements regarding the controlling function in companies or the quality of results it should deliver (U Krings, 2012), the organization of the controlling system differs from one company to another. A basic role metaphor used in literature regards the manager as the captain of a ship (company) and the controller as the navigator. While the captain is responsible for the entire ship, the navigator suggests the right course to reach the set goal. Therefore, the manner the manager and the controller interact is crucial for the success of the company (Amann& Petzold, 2014).
The “Controlling Process-Model” set up by the International Group of Controlling (2012) gives a more structured overview on the portfolio of processes which make up the controlling function in modern companies. This systematic structure can serve as a basis to set up and organize the portfolio of activities of a given controlling function. The allocation of resources to the individual processes depends on the internal needs and pursued initiatives of each company.
The management reporting is one of the 10 controlling main processes as defined by the International Group of Controllers. The respective controlling process model is displayed below:
Table 1: Controlling main processes
Source: International Group of Controlling (2012)
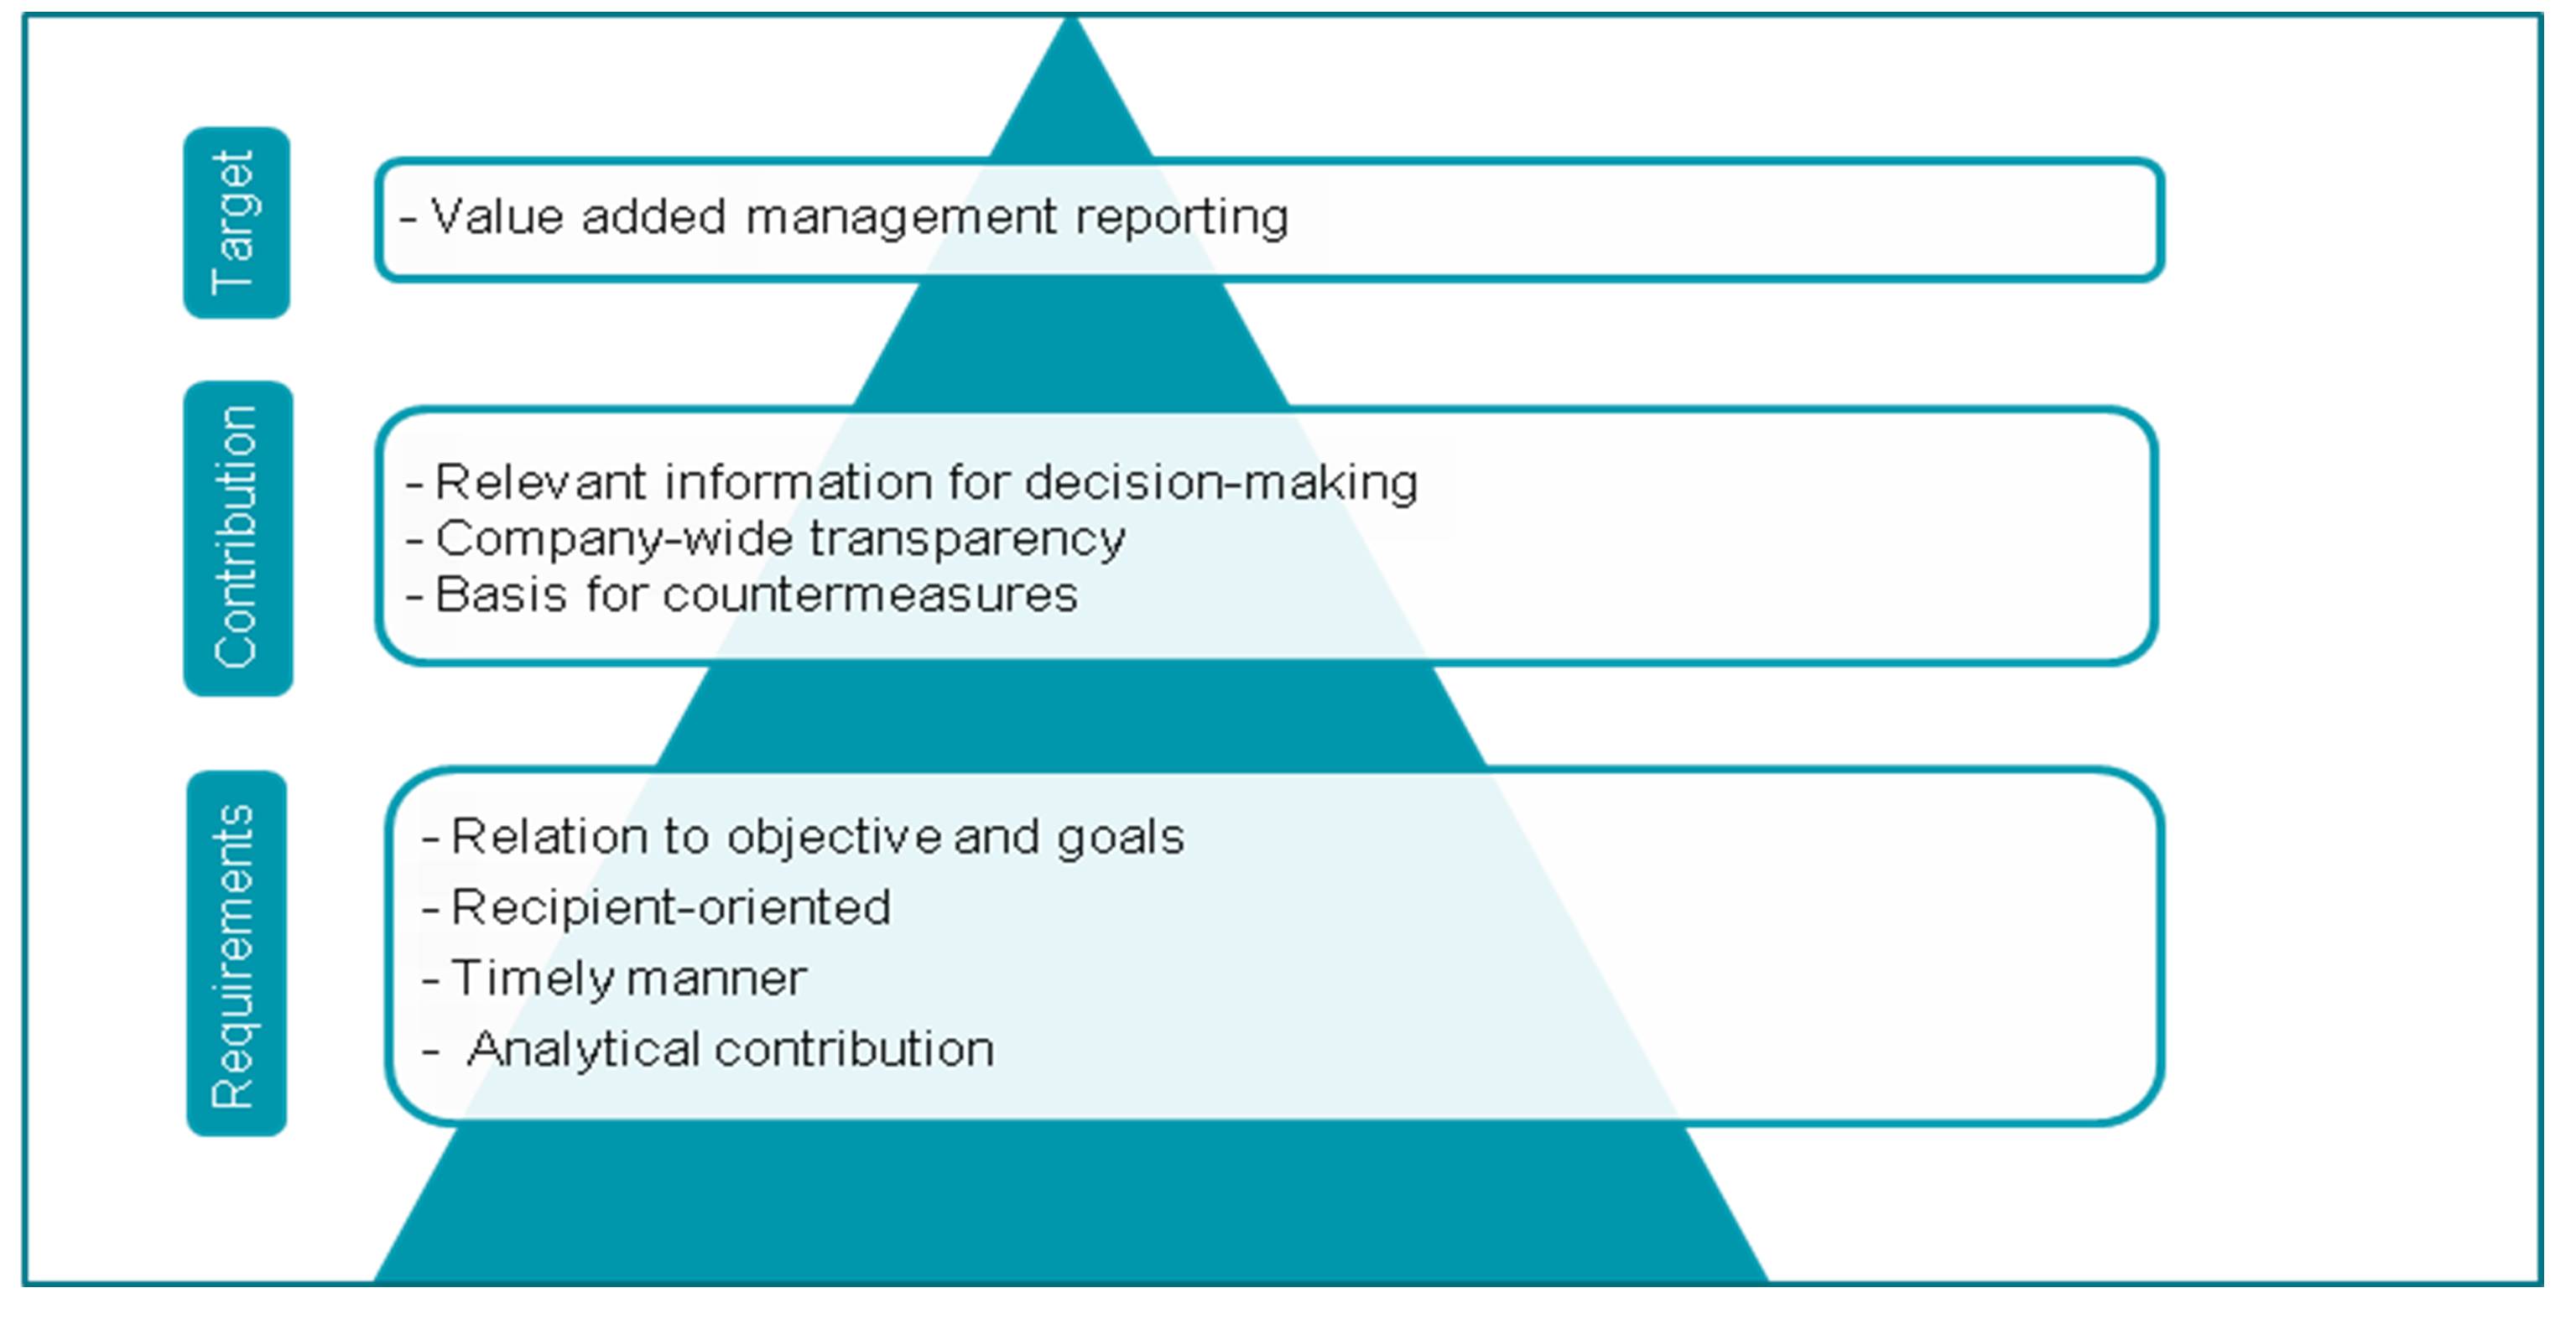
According to the controlling process model, “the aim of management reporting is to produce and deliver information relevant for decision-making in the sense of relation to objective/degree of goal attainment, in a recipient-oriented and timely manner for the control of the company. With the information and documentation task, reporting is to ensure company-wide transparency” (International Group of Controlling, 2012). Based on this, the target, contribution and requirements of the management reporting can be illustrated as follows:
Figure 1: Value added management reporting
Source: Author´s figure
To reach the target of value added management reporting, the management reporting must provide the decision maker with relevant information in relation to the goals he pursues. Management reporting can only provide this contribution as far as the outlined requirements are respected. To better demonstrate this concept, the requirements for value added management reporting shall be illustrated.
 The reporting content needs to be related to the way the company is steered. The objectives and goal settings of the strategic planning have to be aligned with the operative management reporting and the management reporting itself has to be aligned with the way the operative units are steered.
 The reports need to be designed to support the decision maker and not to please the financial organization. An over engineering of the management reporting and by this a loss of relevance for the decision maker should be avoided.
 To be a basis for counter measures, the cause and effect relationships of the reported data need to be separated and made transparent. The causes for an unfavorable development need to be clarified in the report as a basis to identify and manage countermeasures.
Analysis and benchmarking of the existing management reporting
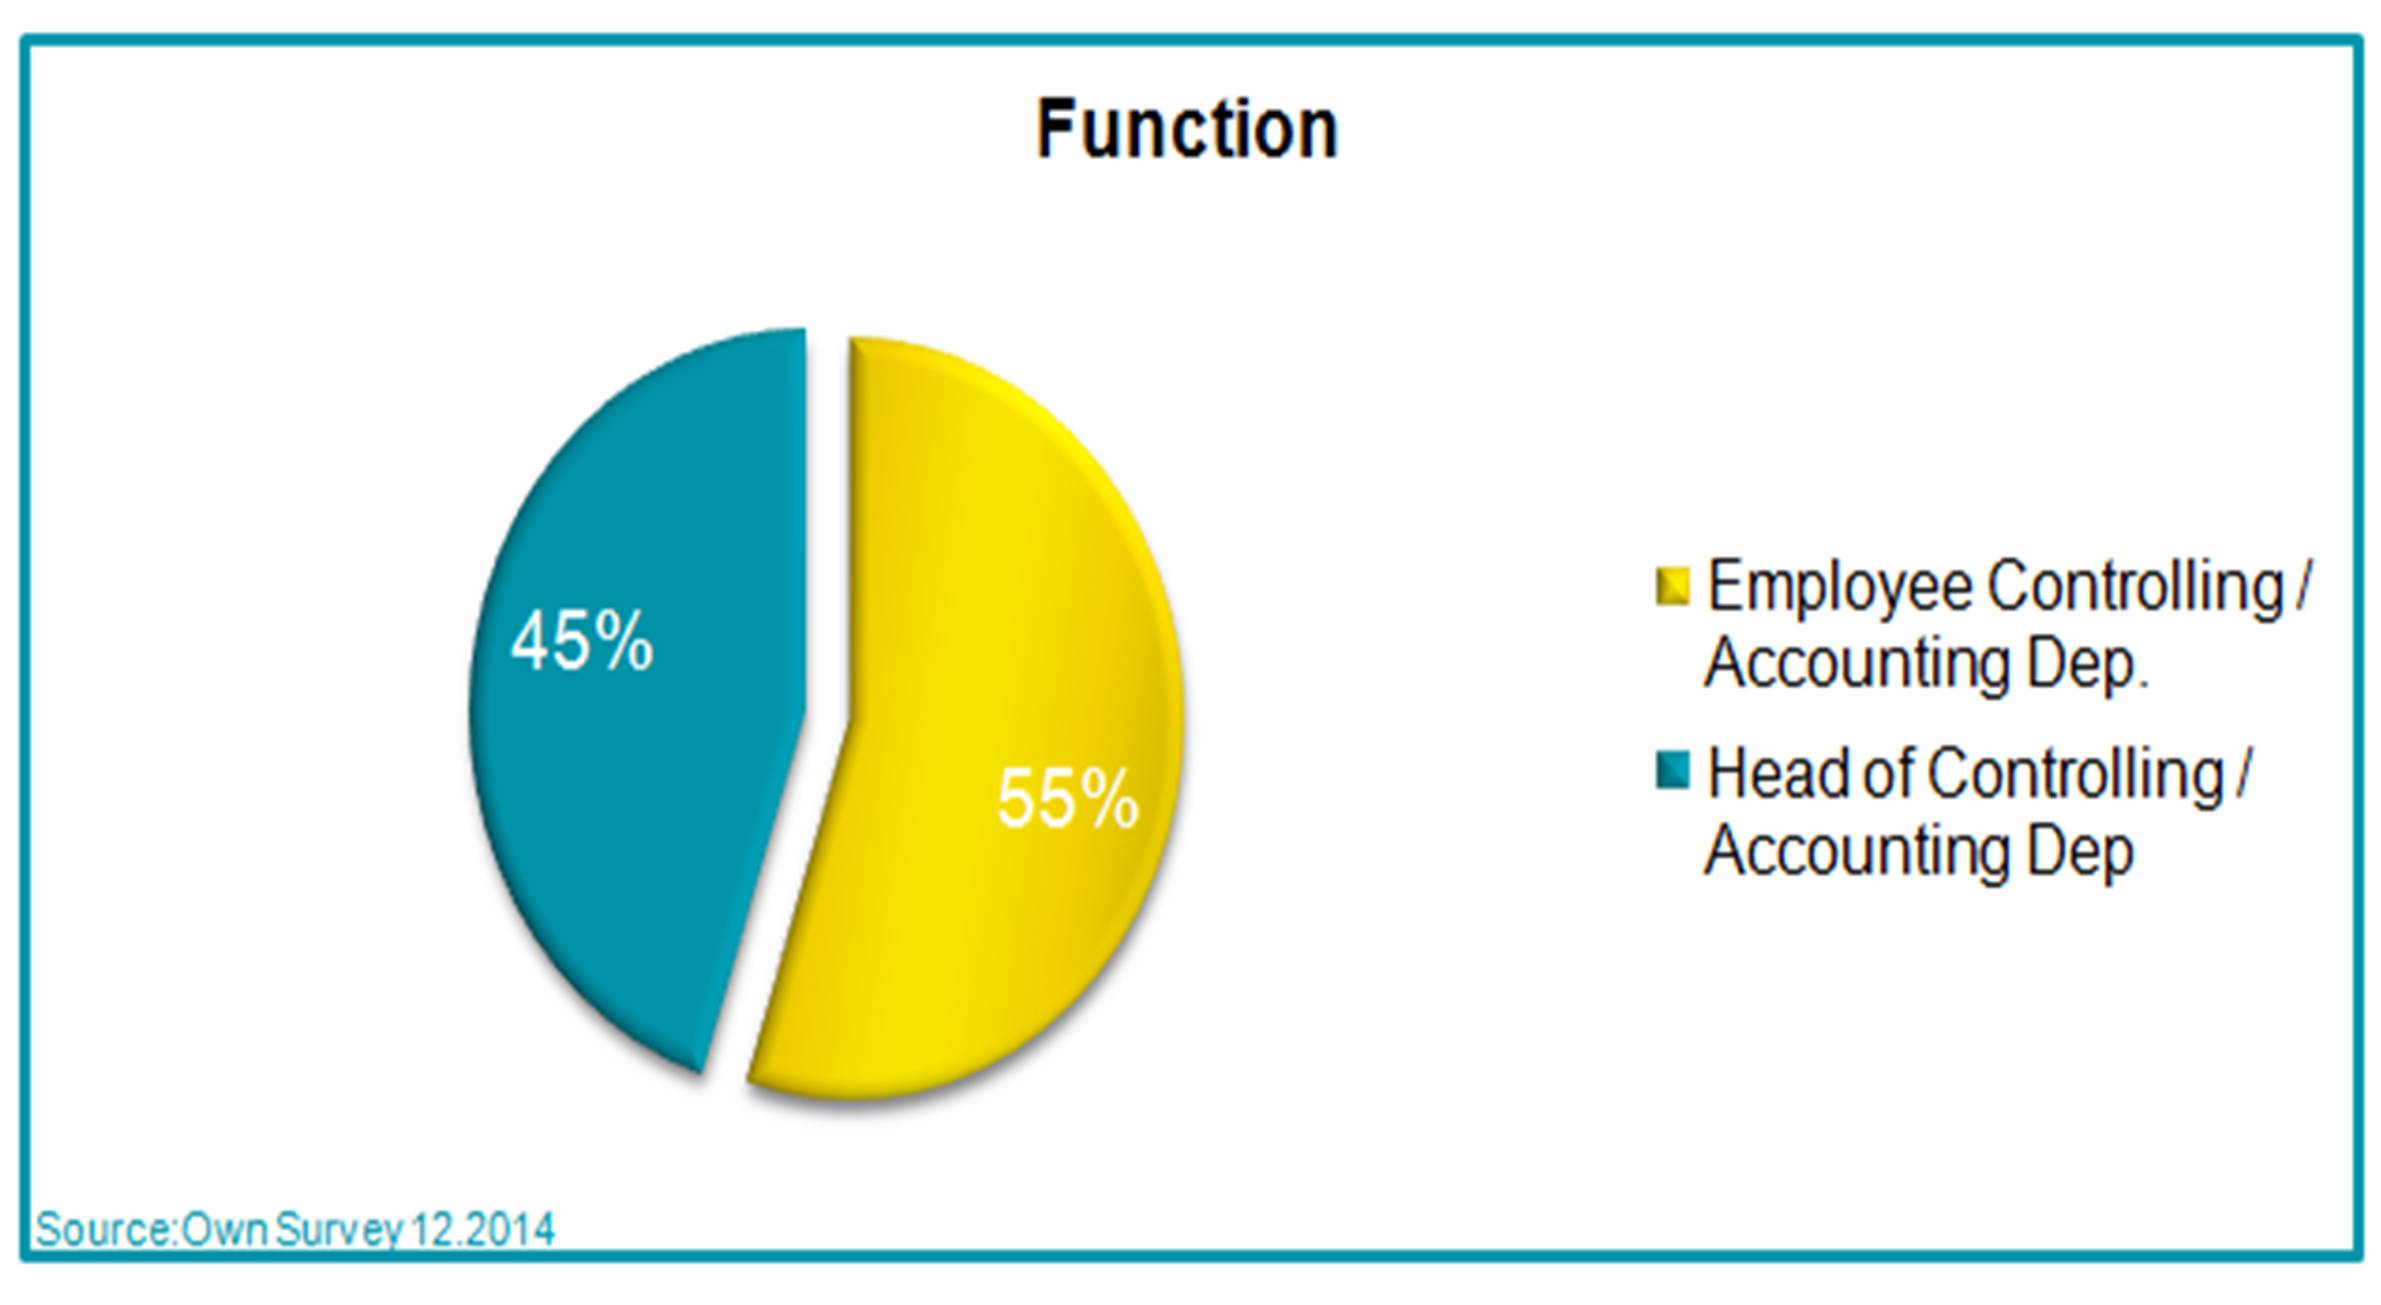
The goal of the case study was to increase the value added of management reporting activities at a global manufacturing company. The starting point of this improvement project was a survey made by the author during December 2014 with 20 controllers and finance managers of this company in seven plants in Eastern Europe as well as in the global headquarter. To better interpret and analyze this survey, the results were benchmarked with a reference survey (“reference”) made by Deloitte Consulting between December 2012 and January 2013. The reference included 143 participants across different branches, company sizes and company types from 12 countries, with a focus on Denmark, Germany and Netherlands. The structure of survey participants is displayed in the next set of graphs.
Figure 2: Participants by function (survey)
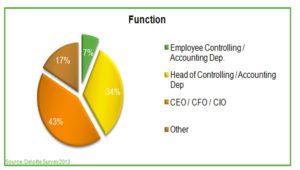 Figure 3: Participants by function (reference)
Source: Based on Deloitte (2013)
Both surveys included the same set of questions. The total amount of questions in both surveys was 30. This article will present a selection of the original questions/answers in both surveys which indicated the highest improvement potential for the management reporting. The results of the author´s survey are always shown on the left with blue color. For comparative reasons, the reference results are indicated in green on the right side. The results of the reference survey are shown in the text in brackets.
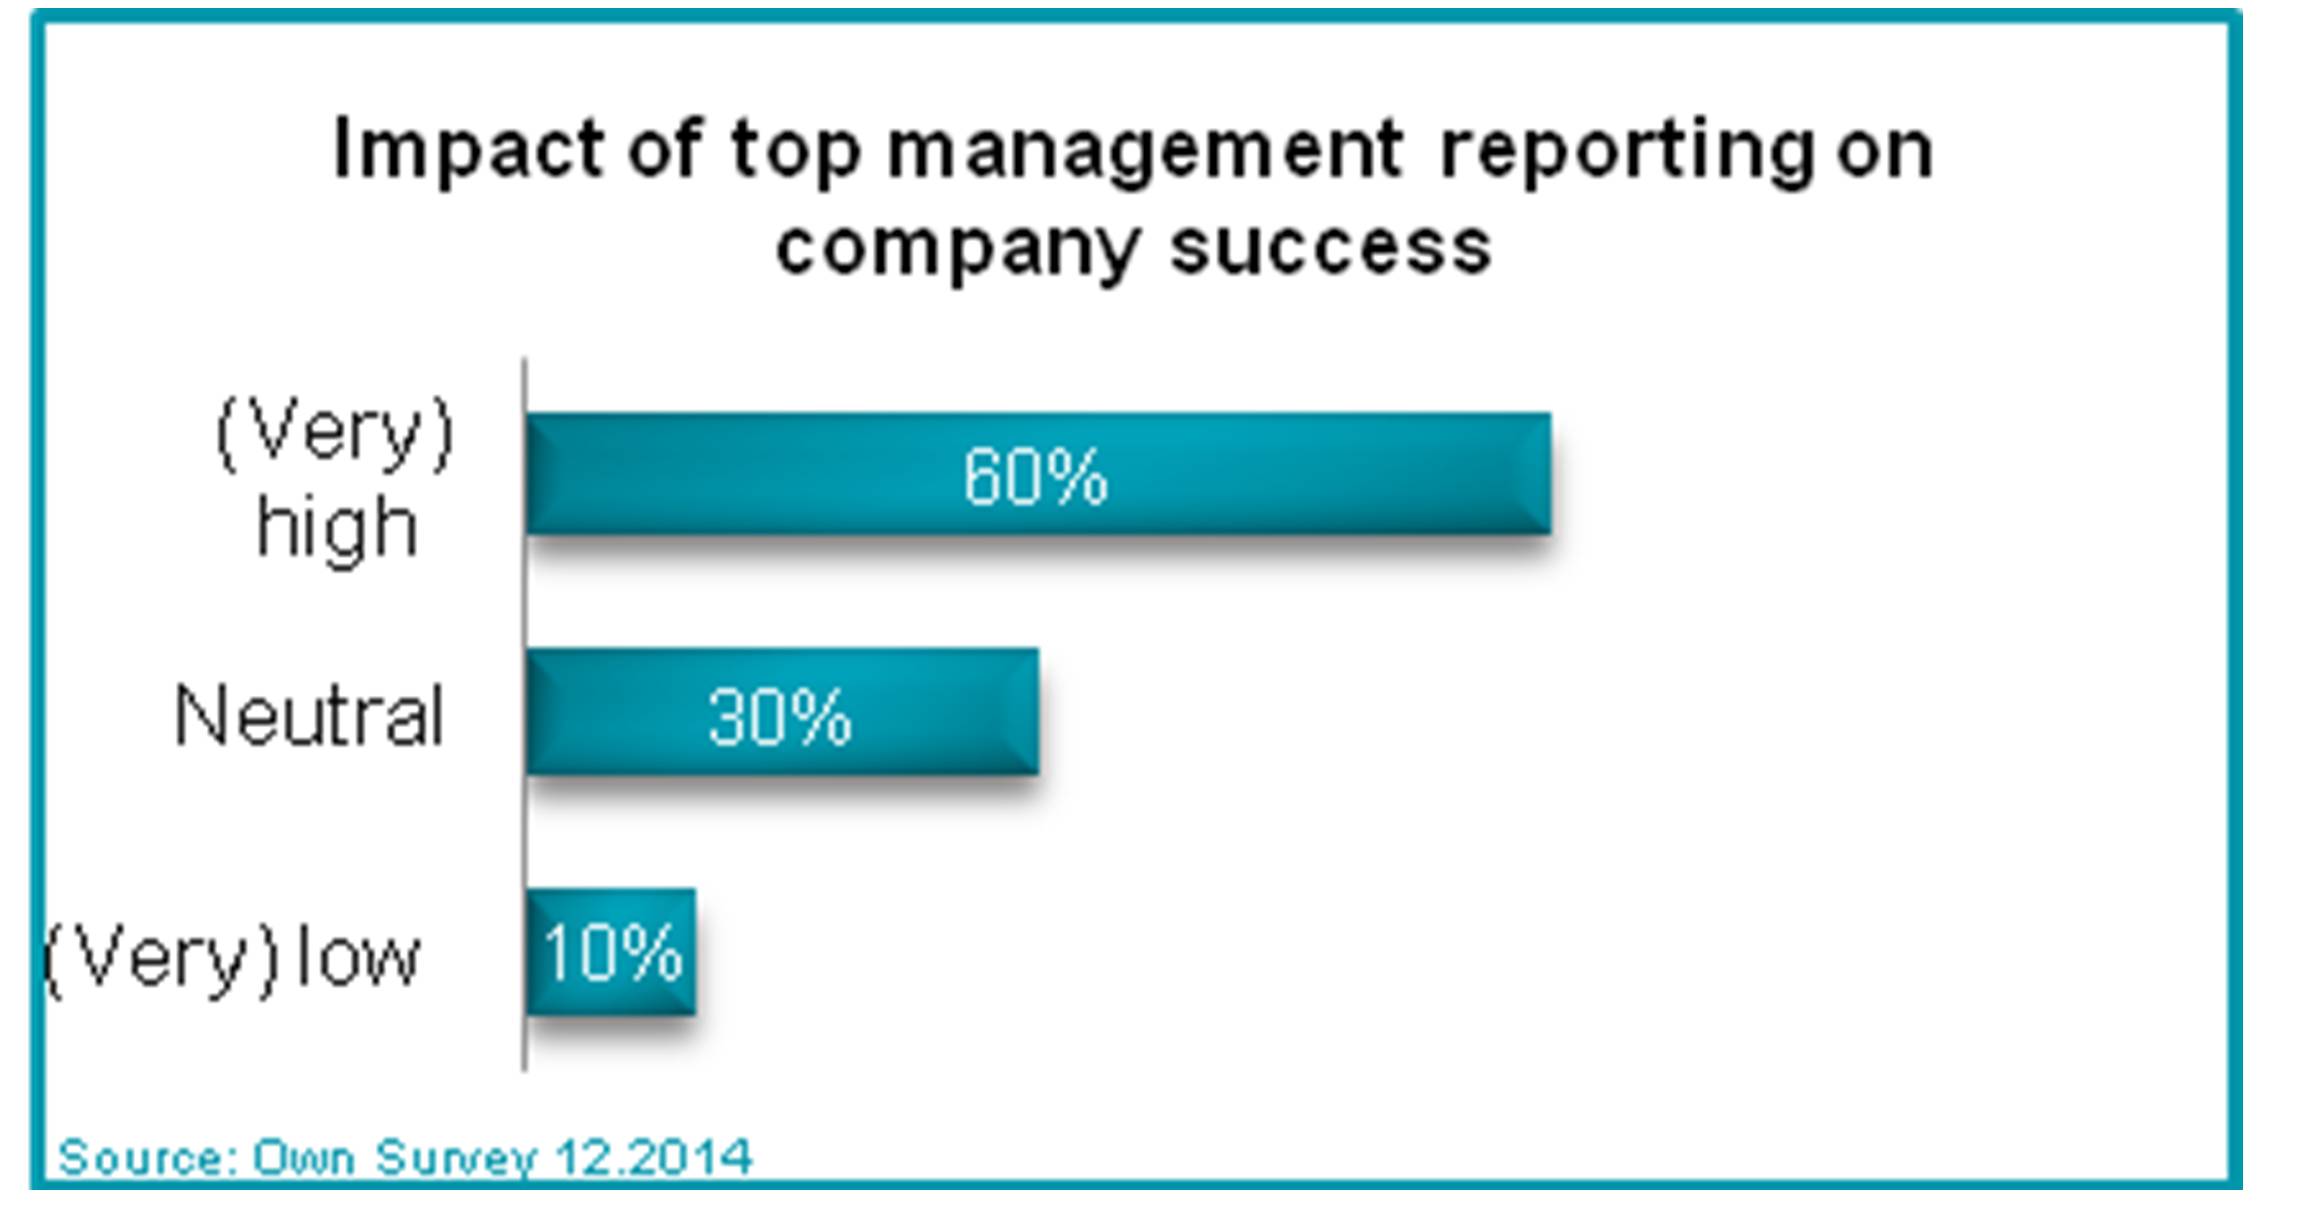
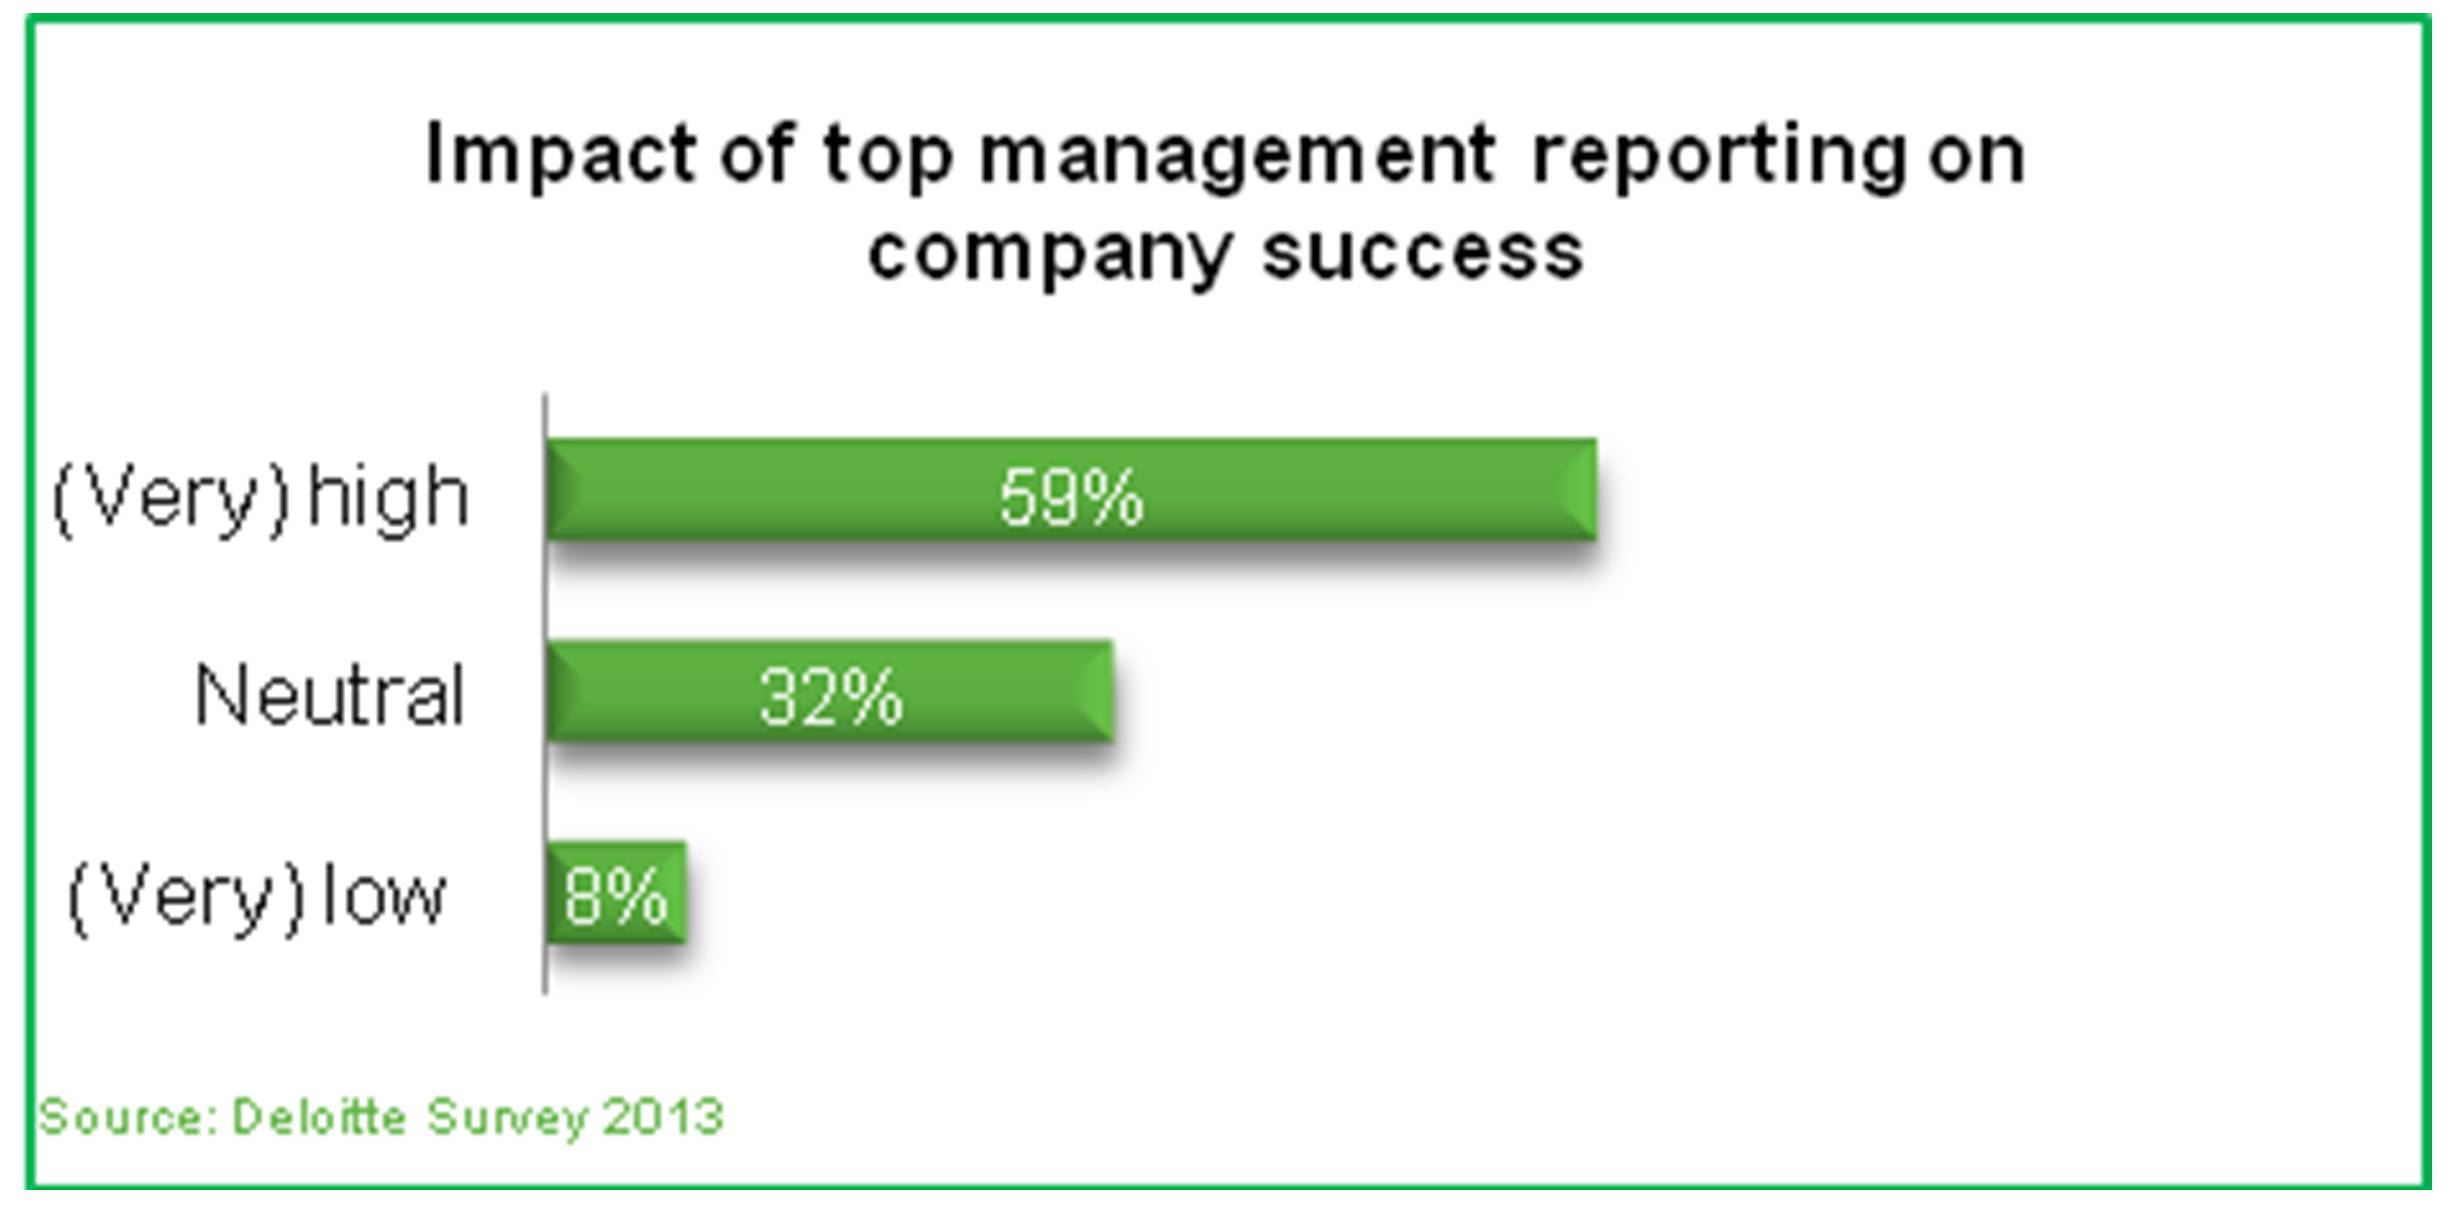
The majority of the survey participants see a high or very high impact of the top management reporting on the company’s success. Only a minority of 8-10% see a low impact. The result of the survey is almost identical with the result of the reference survey confirming that management reporting has a significant impact on the company’s success:
Figure 4: Impact on company success (survey)
Source: Author´s survey
Figure 5: Impact on company success (reference)
Source: Based on Deloitte (2013)
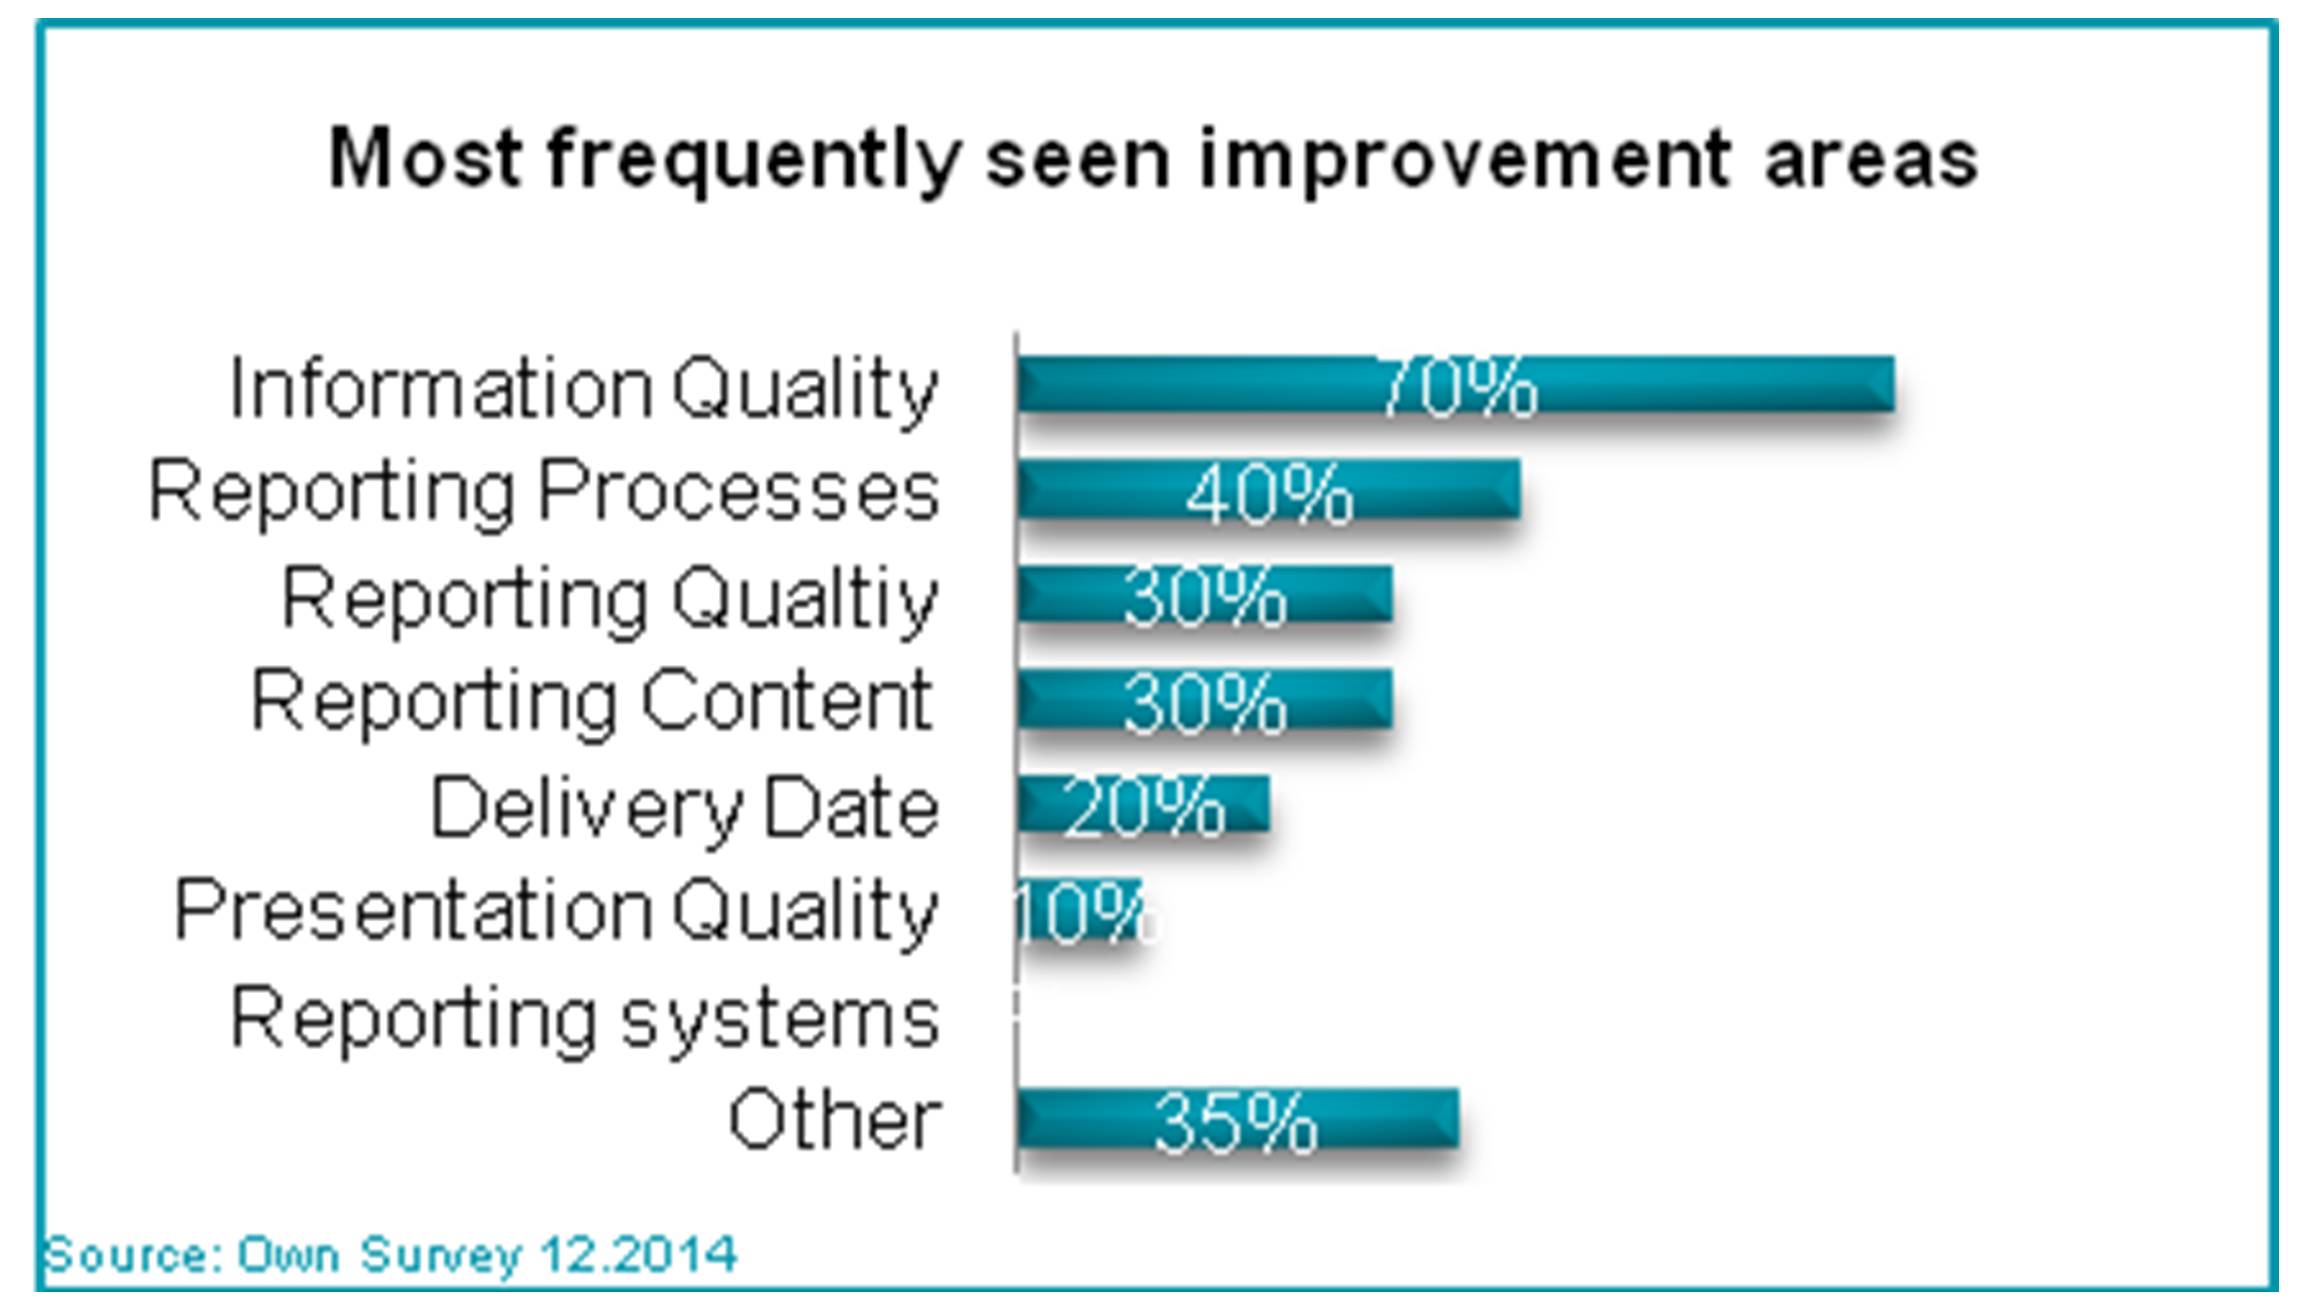
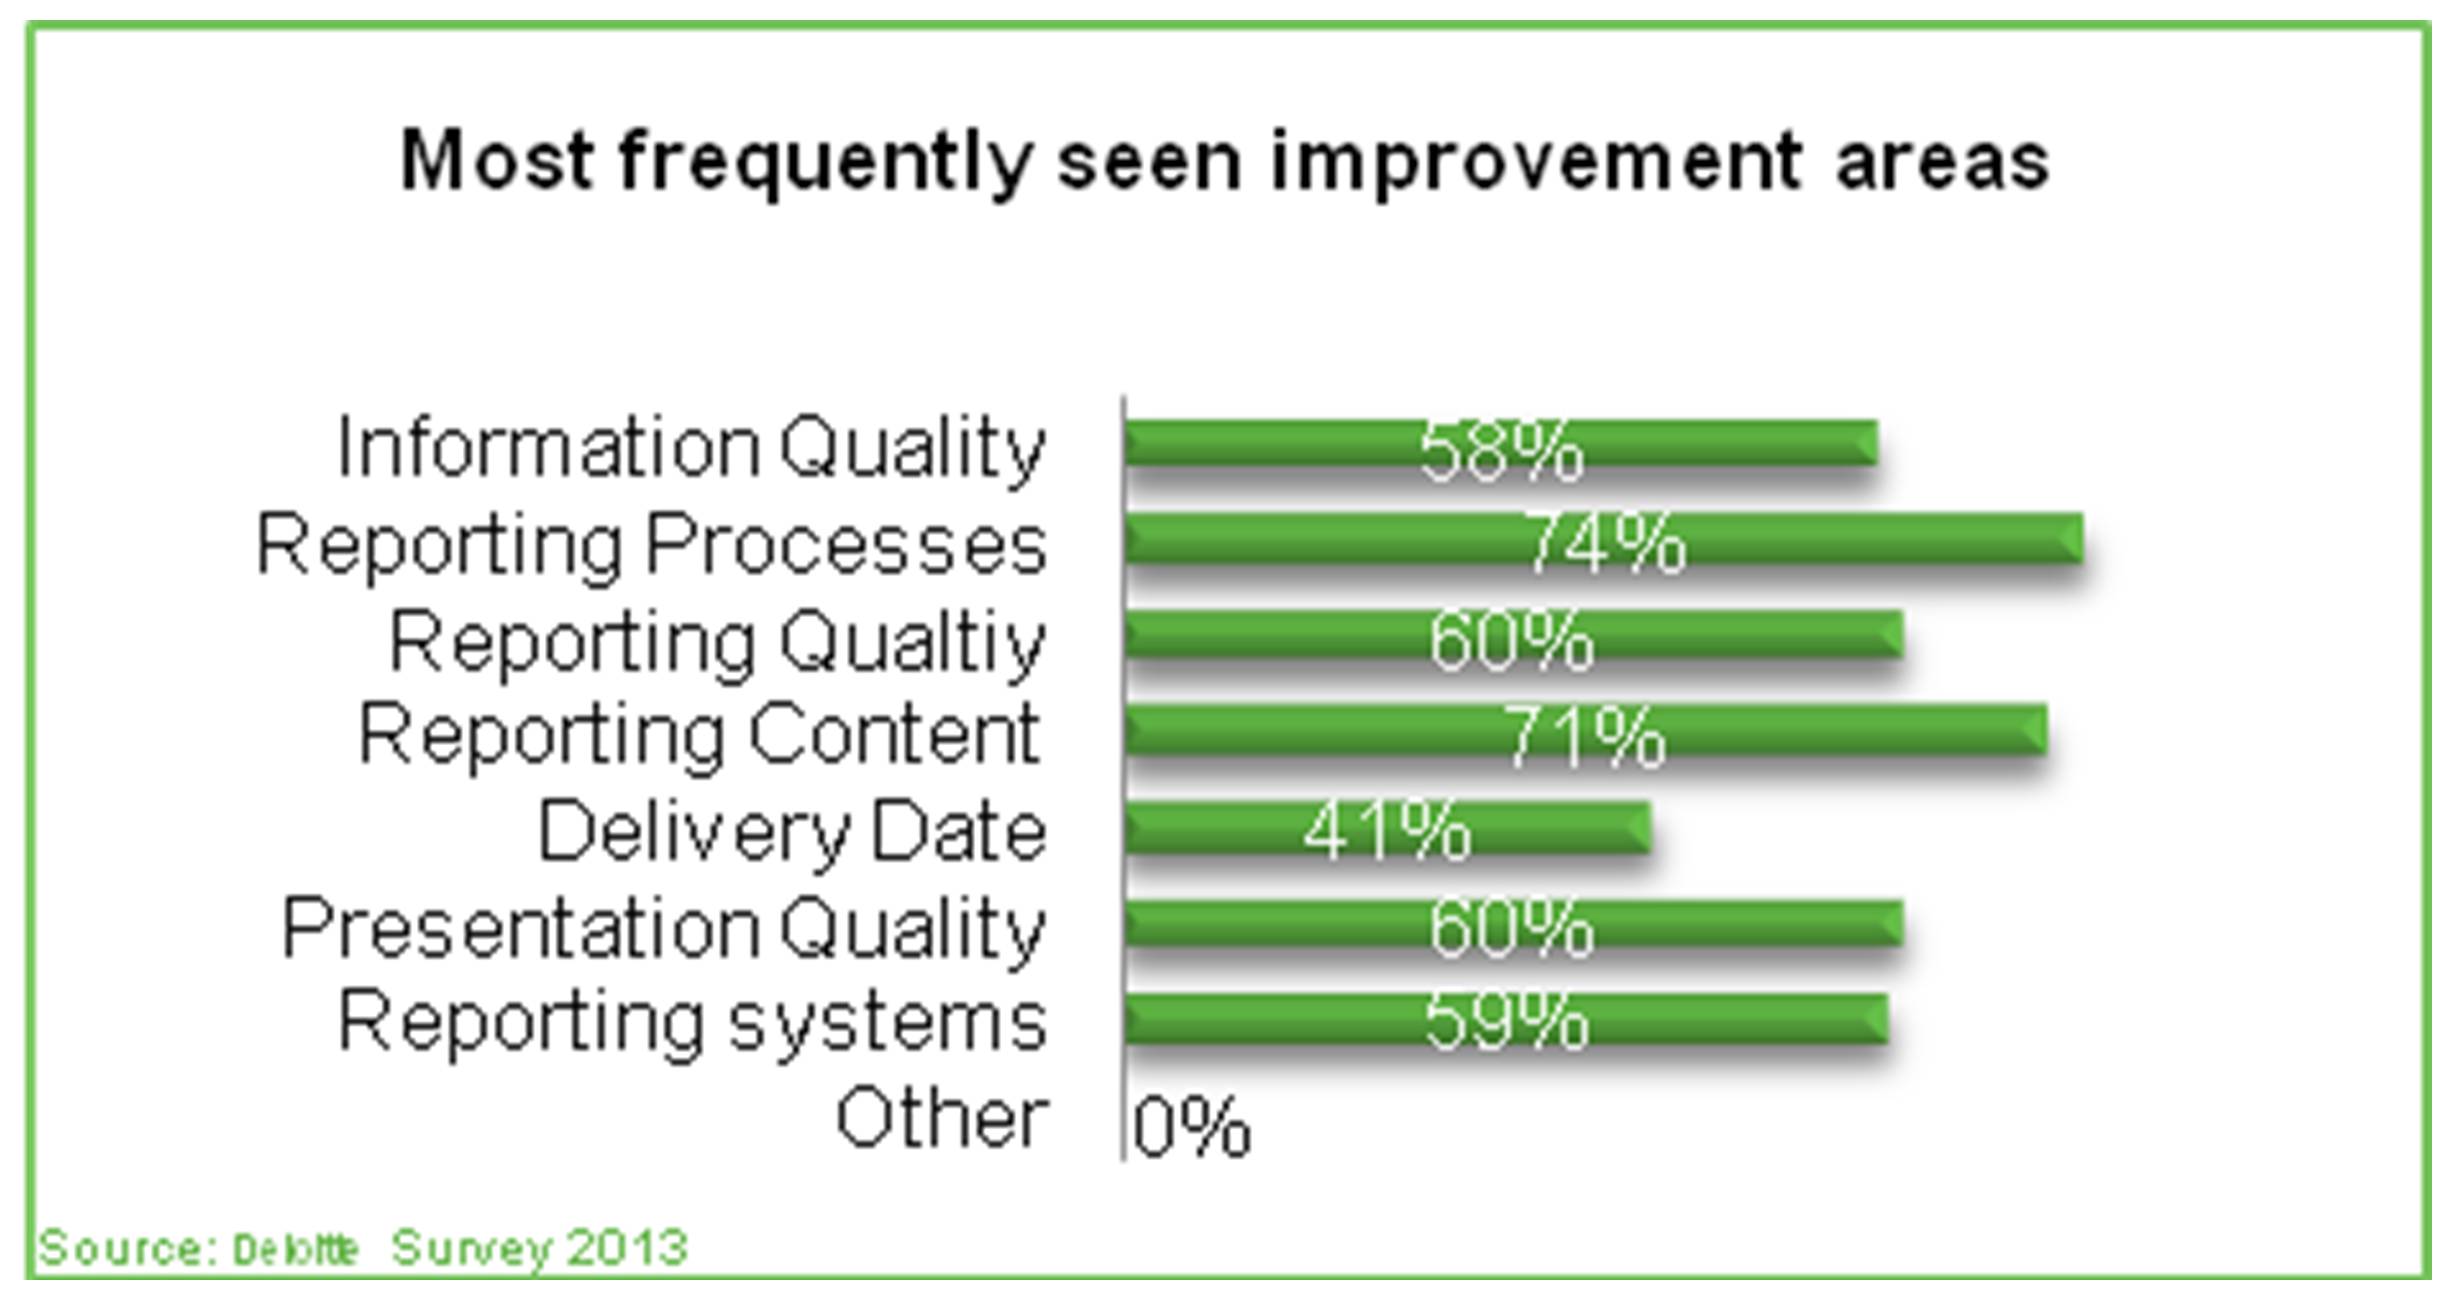
Despite the high impact of the management reporting, the participants of both surveys saw huge improvement potentials in many areas of the management reporting. Almost all respondents highlighted more than one improvement area:
Figure 6: Improvement areas (survey)
Source: Author´s survey
Figure 7: Improvement areas (reference)
Source: Based on (Deloitte, 2013)
Interpreting and comparing the results of both surveys, the author´s survey tends to indicate a clearer ranking between the answer options. This tendency to prioritize answers for a clearer result is due to a recommendation given in the author´s study to avoid selecting too many results. The answers of the reference survey are in comparison often closer to each other.
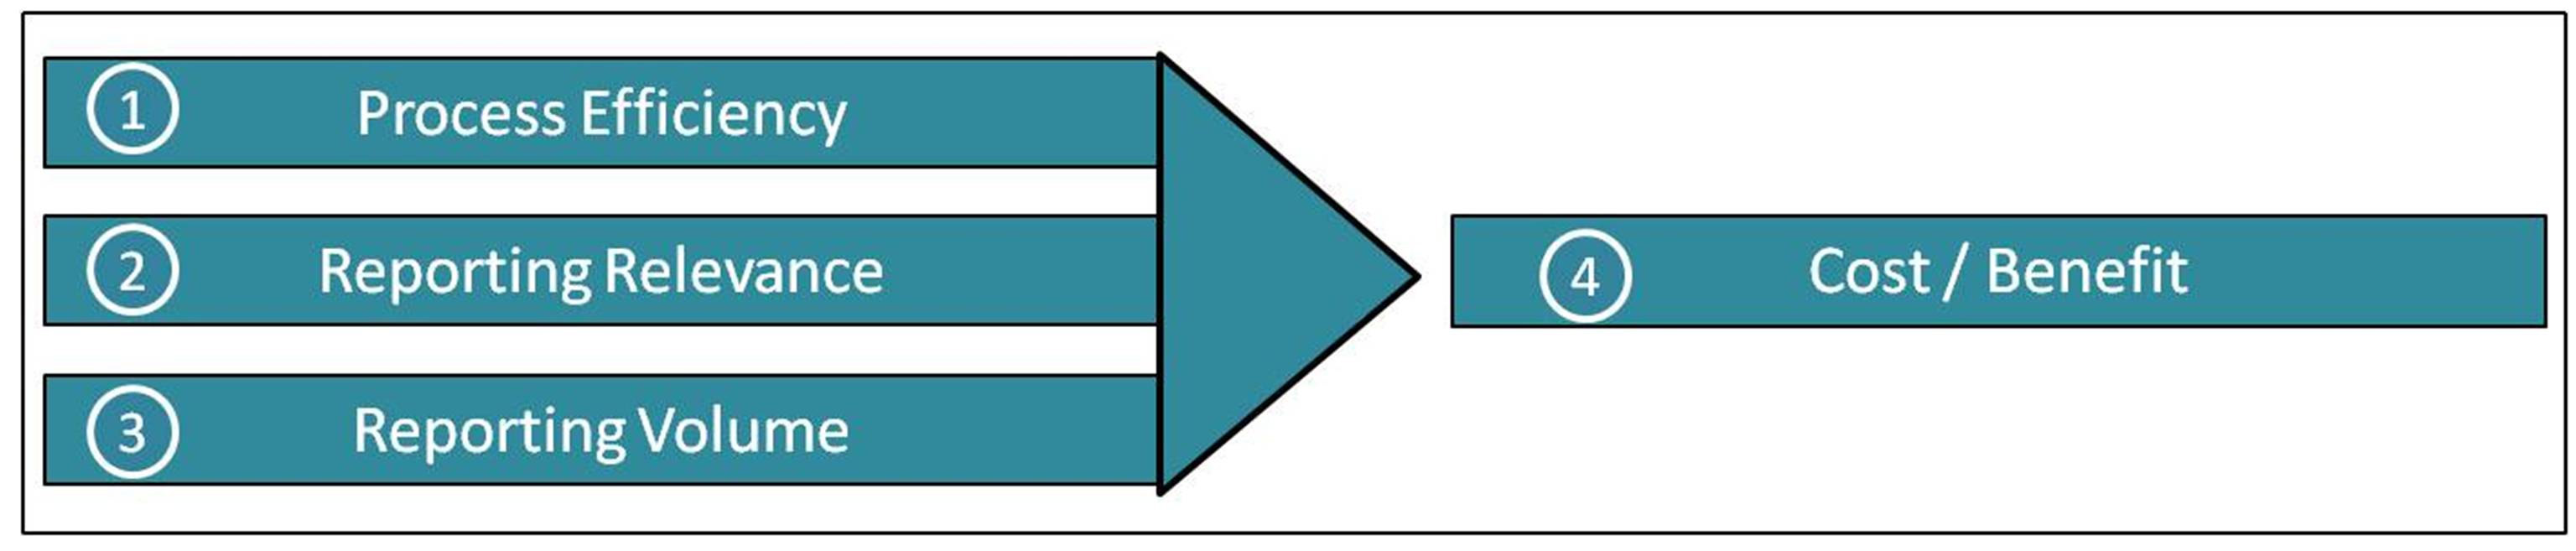
Elaboration of improvement measures and performed implementation
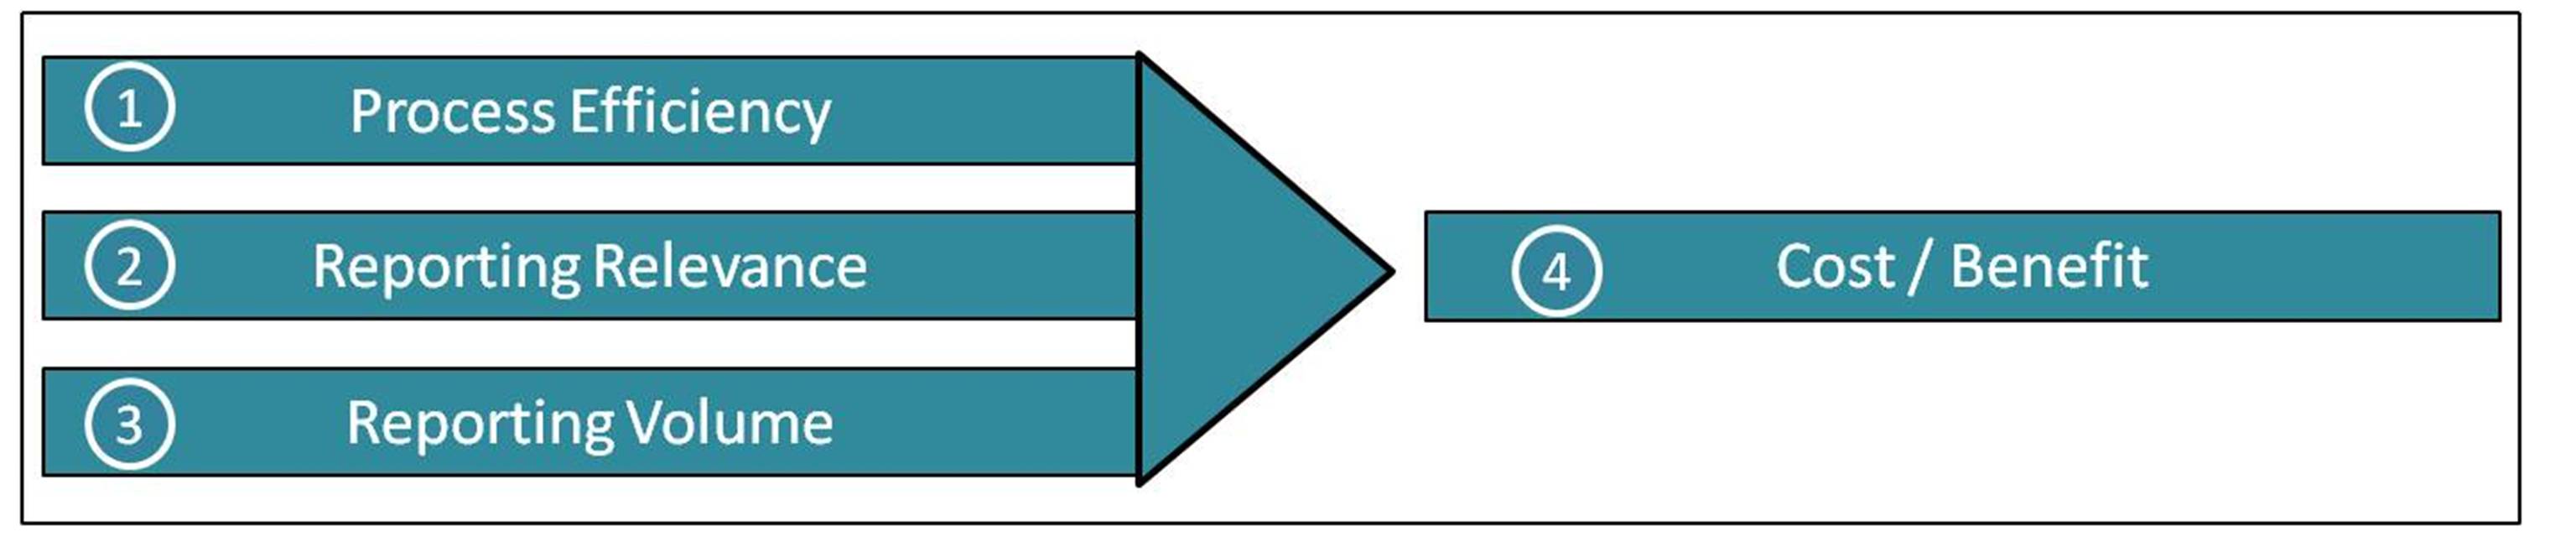
The survey revealed various areas with improvement potential. The areas selected for further analysis are presented in figure 8:
Figure 8: Selected areas for improvement
Source: Author´s figure
A selection of the original questions/answers in both surveys, which indicated the highest improvement potential for the management reporting, is presented below. The improvement area of process efficiency will be outlined based on an implemented case study. The other improvement areas will be further outlined in a conceptual manner.
Process efficiency
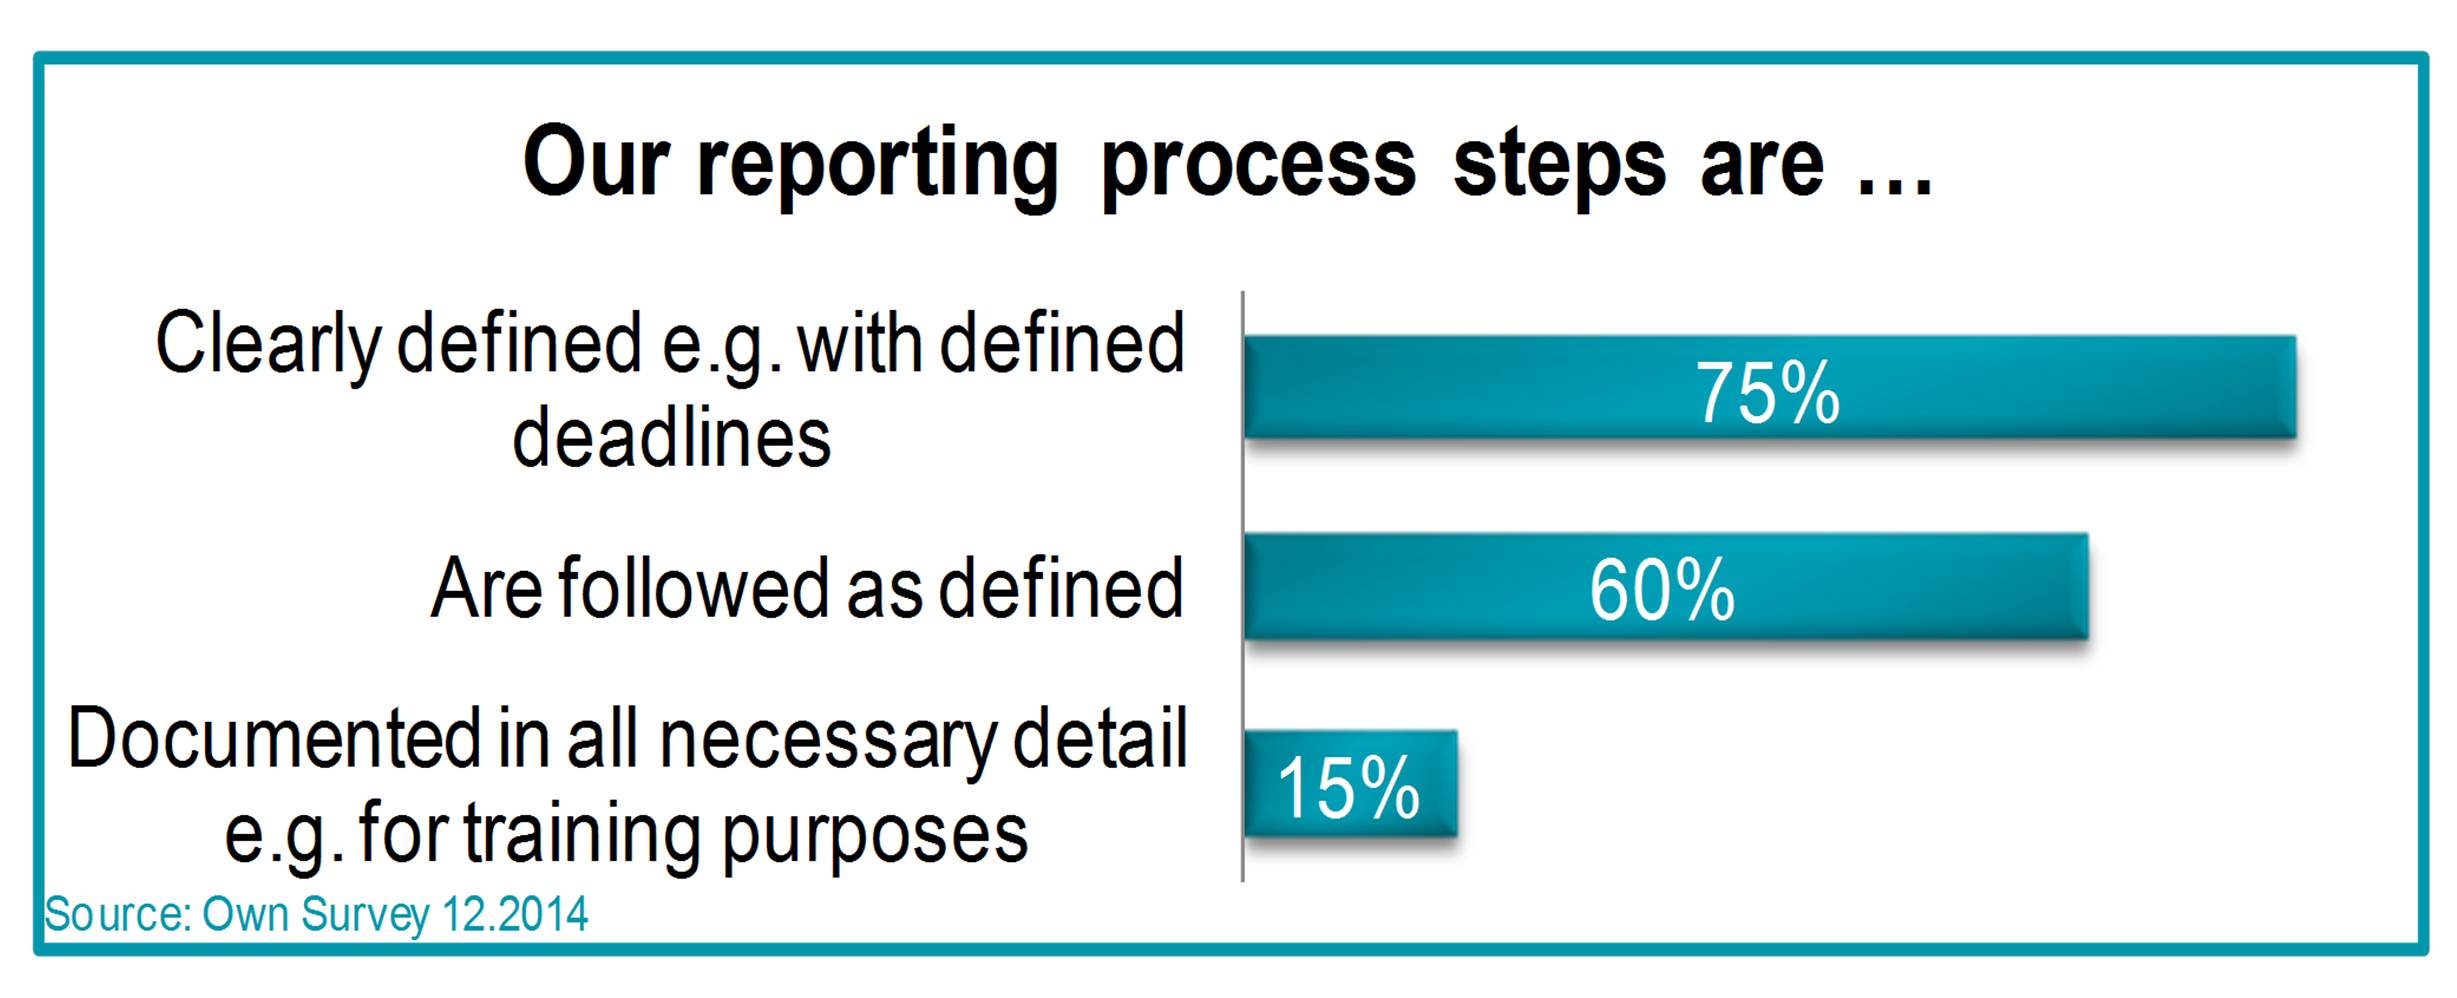
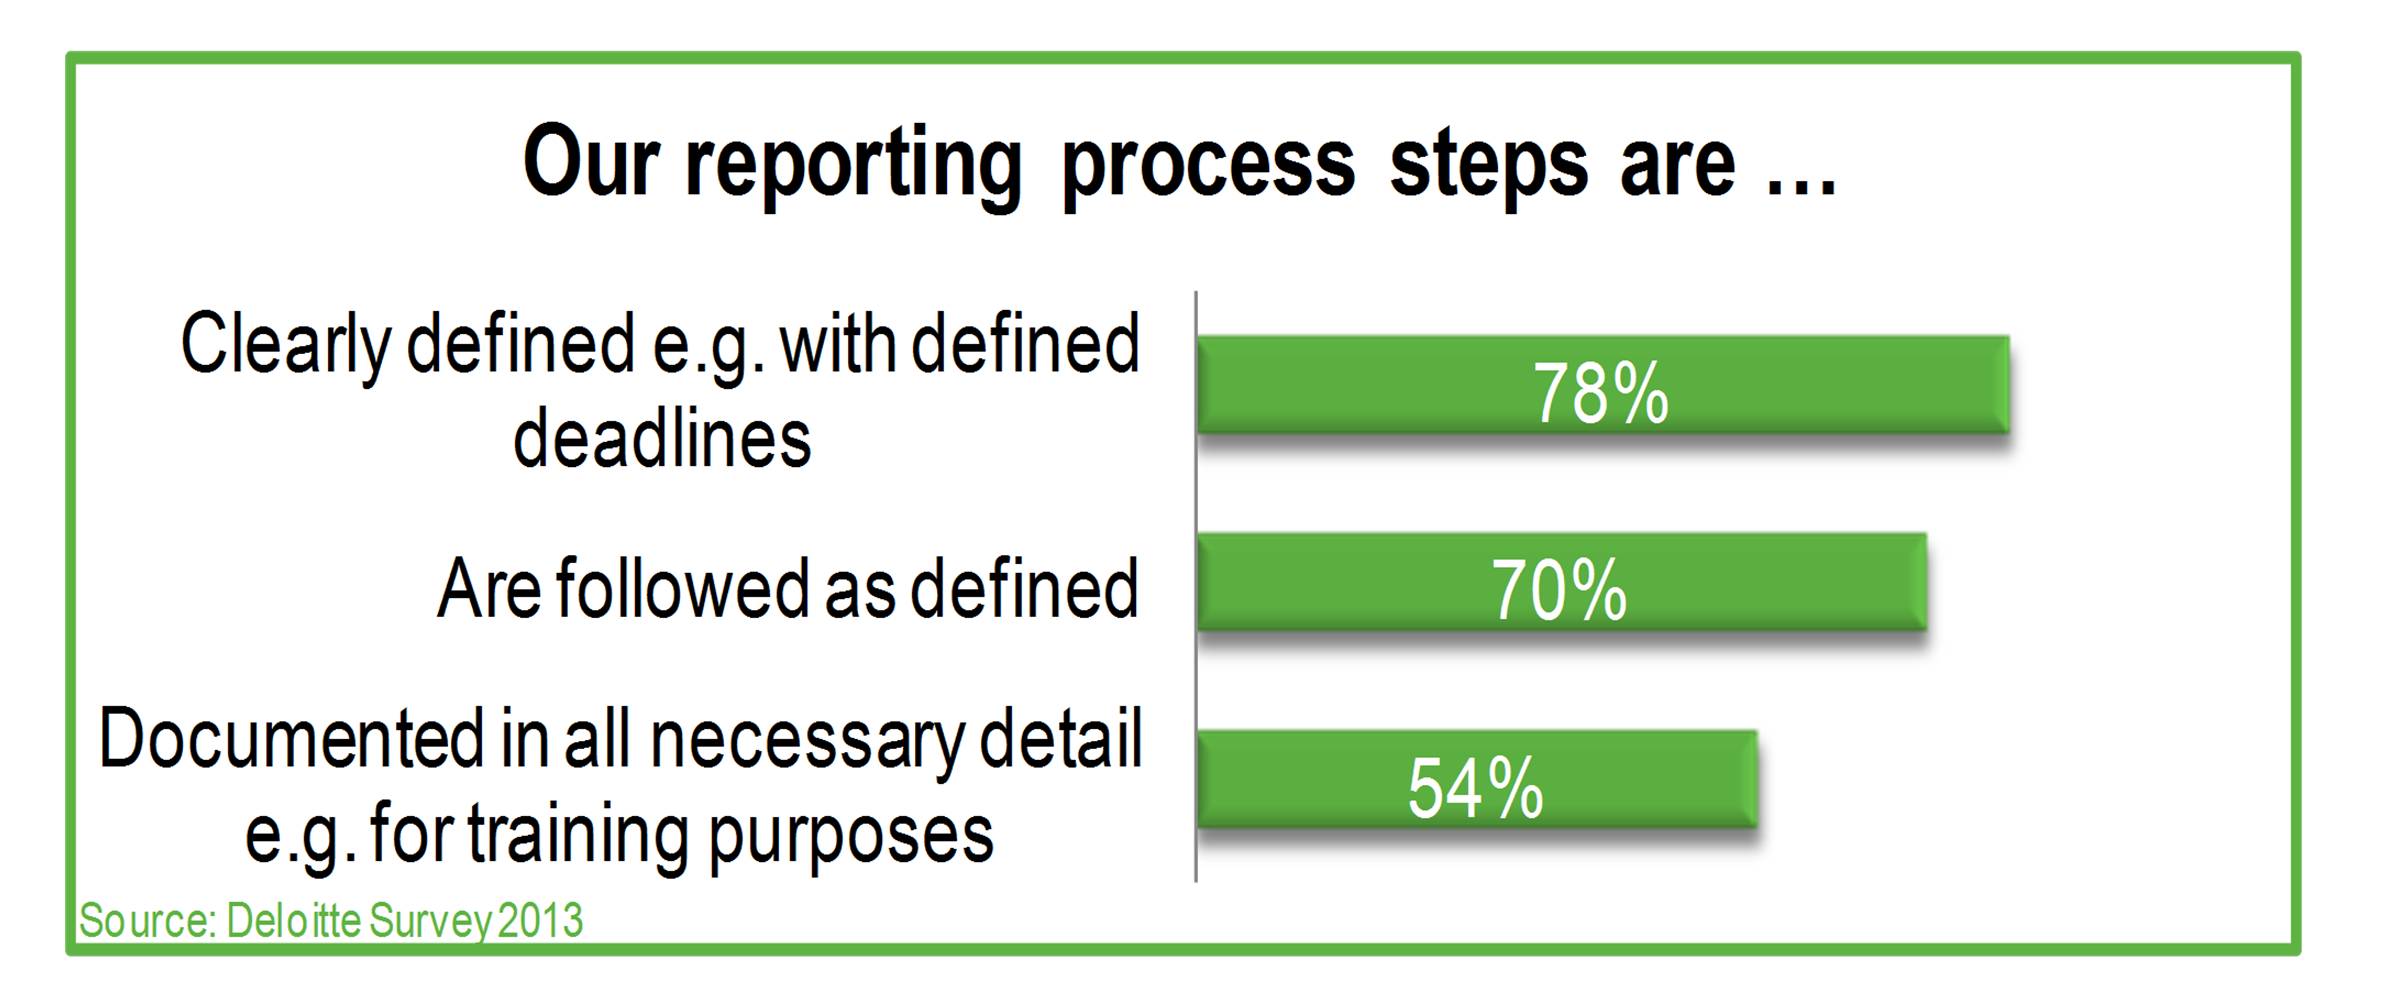
In the author´s survey as well as in the reference survey the level of detail of the reporting process documentation was considered comparably low when it comes to training purposes of new employees:
Figure 9: Reporting process steps (survey)
Source: Author´s survey
Figure 10: Reporting process steps (reference)
Source: Based on Deloitte (2013)
85% of the participants in the author´s survey (46% in the reference survey) were of the opinion, that the reporting process was not documented in the necessary details e.g. for training purposes. As the satisfaction with the process documentation in the author´s survey was significantly below the benchmark, the process documentation was chosen as the first optimization object. The project performed on a group of five plants simultaneously will be illustrated as a case study. Starting points for the improvement process were the following identified improvement needs:
Figure 11: Starting points of the case study
Source: Author´s figure
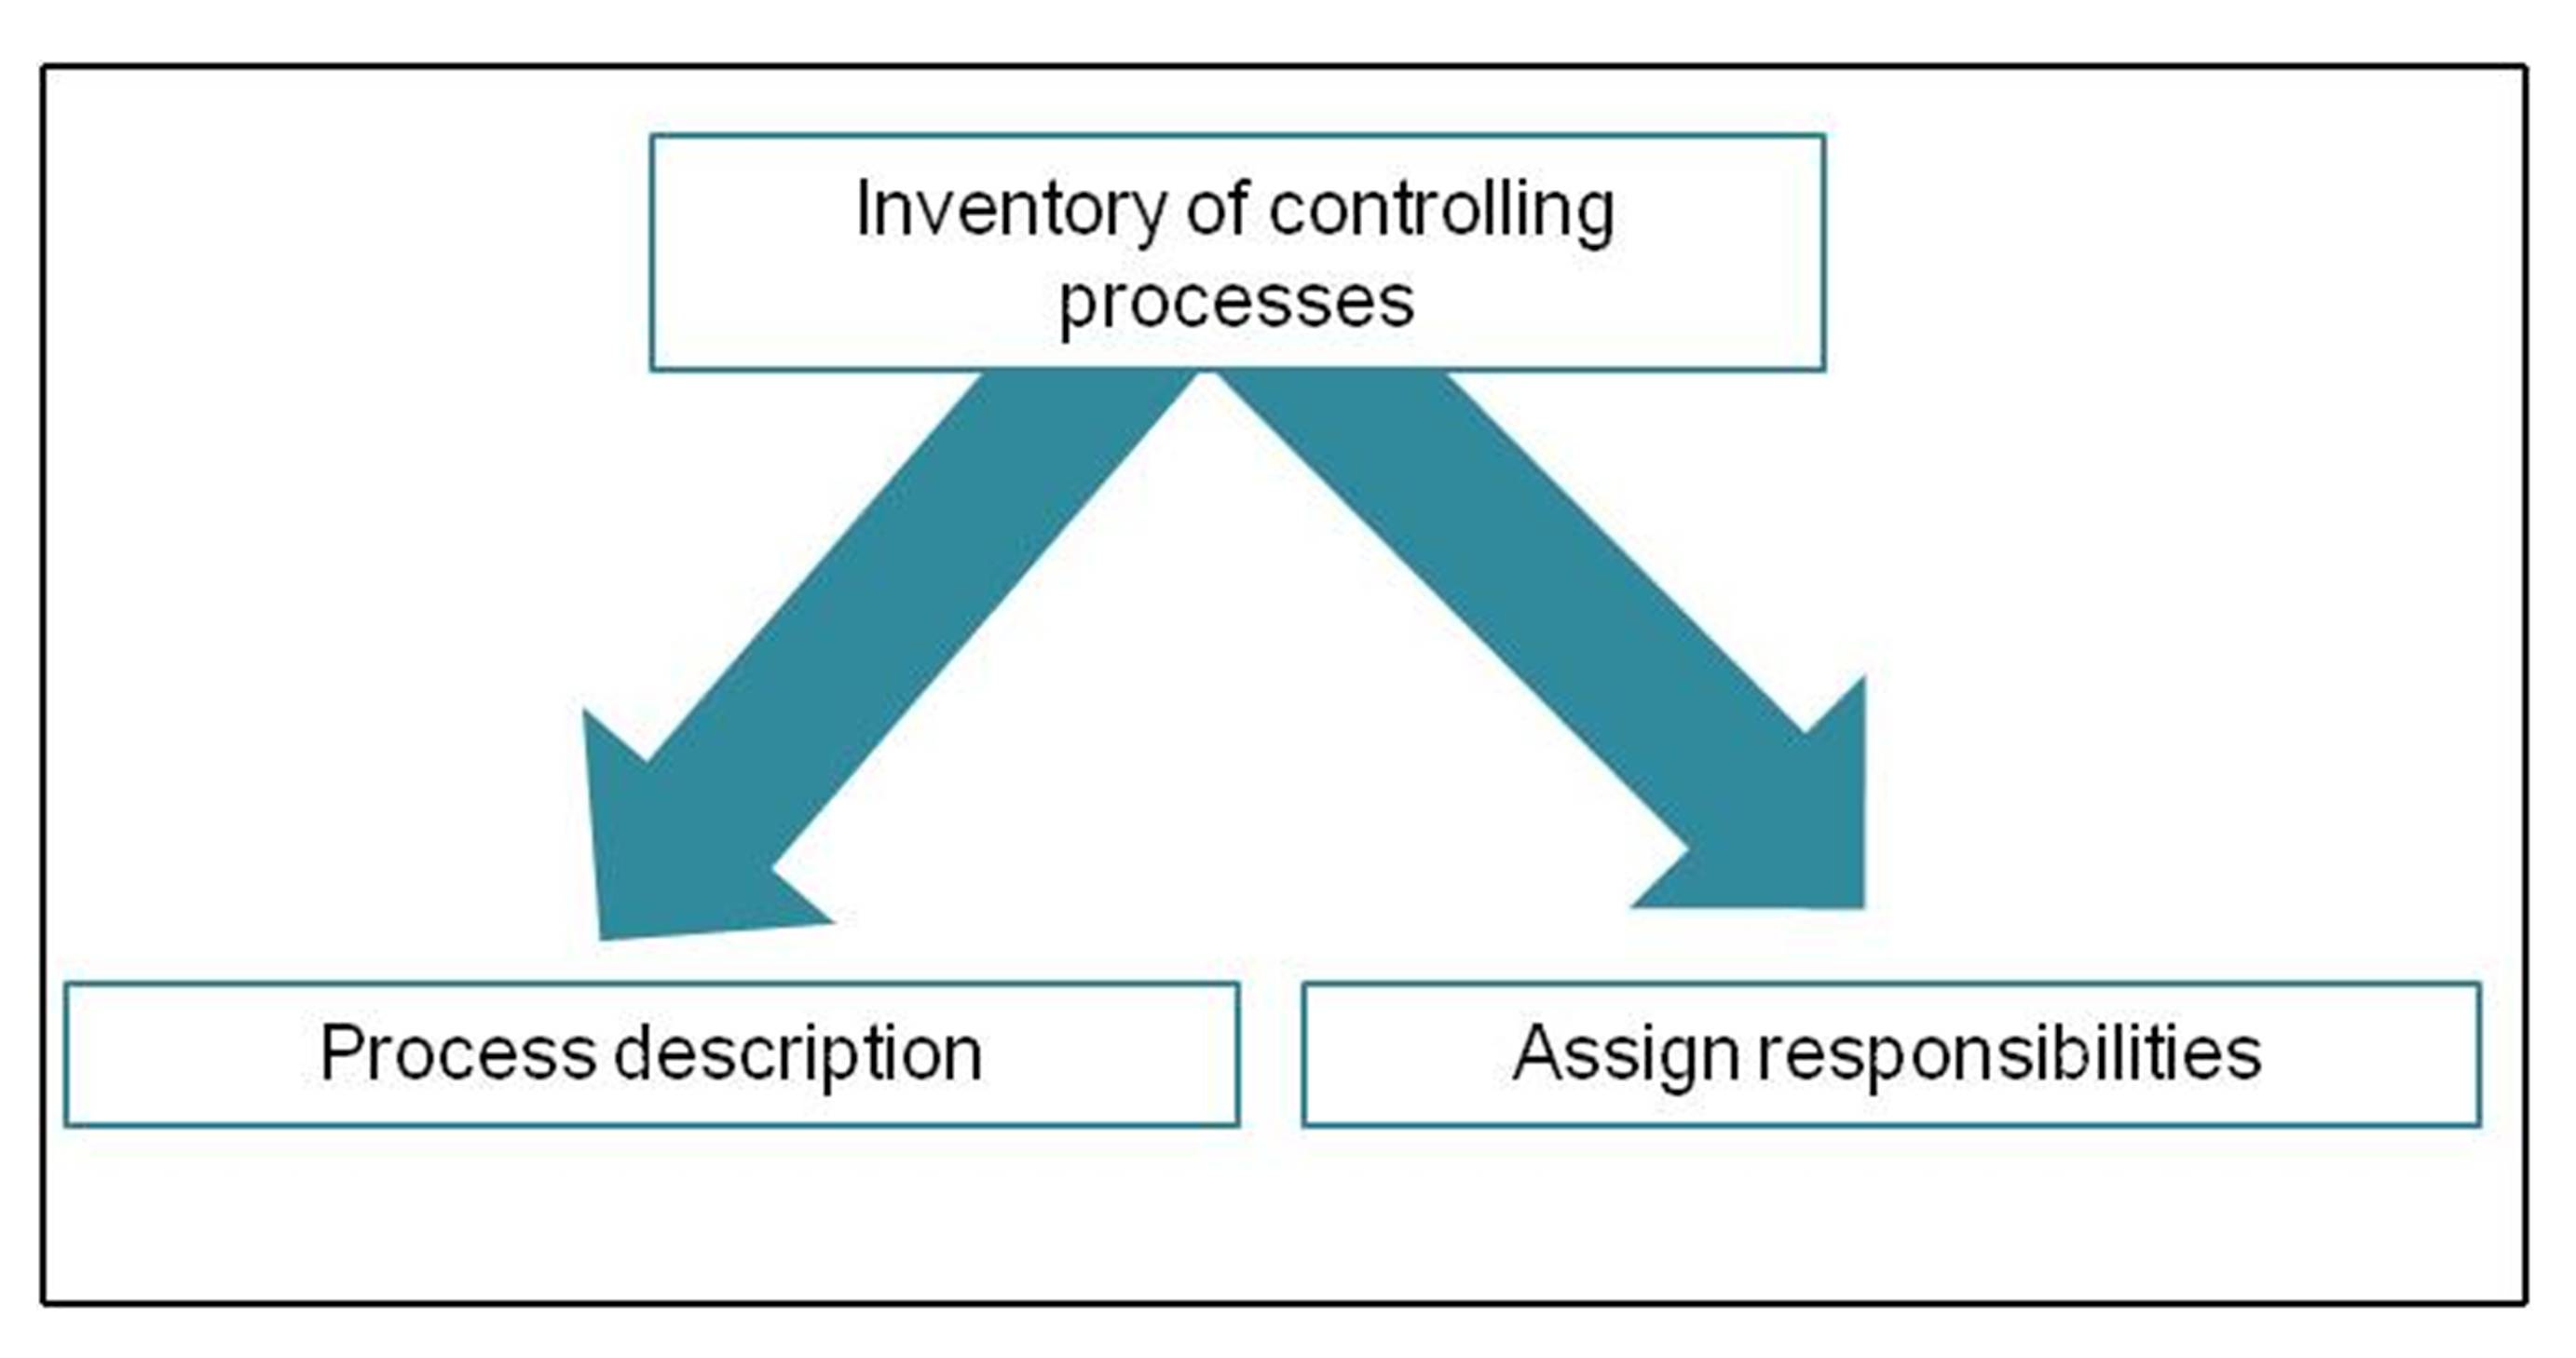
These identified improvement needs lead to a project to set up a controlling manual containing work instructions which can be used in the training of the new employees and interns. The project was structured in three working packages: (1) to inventory all relevant processes (2) to describe the processes and (3) to assign responsibilities including back up:
Figure 12: Project steps
Source: Author´s figure
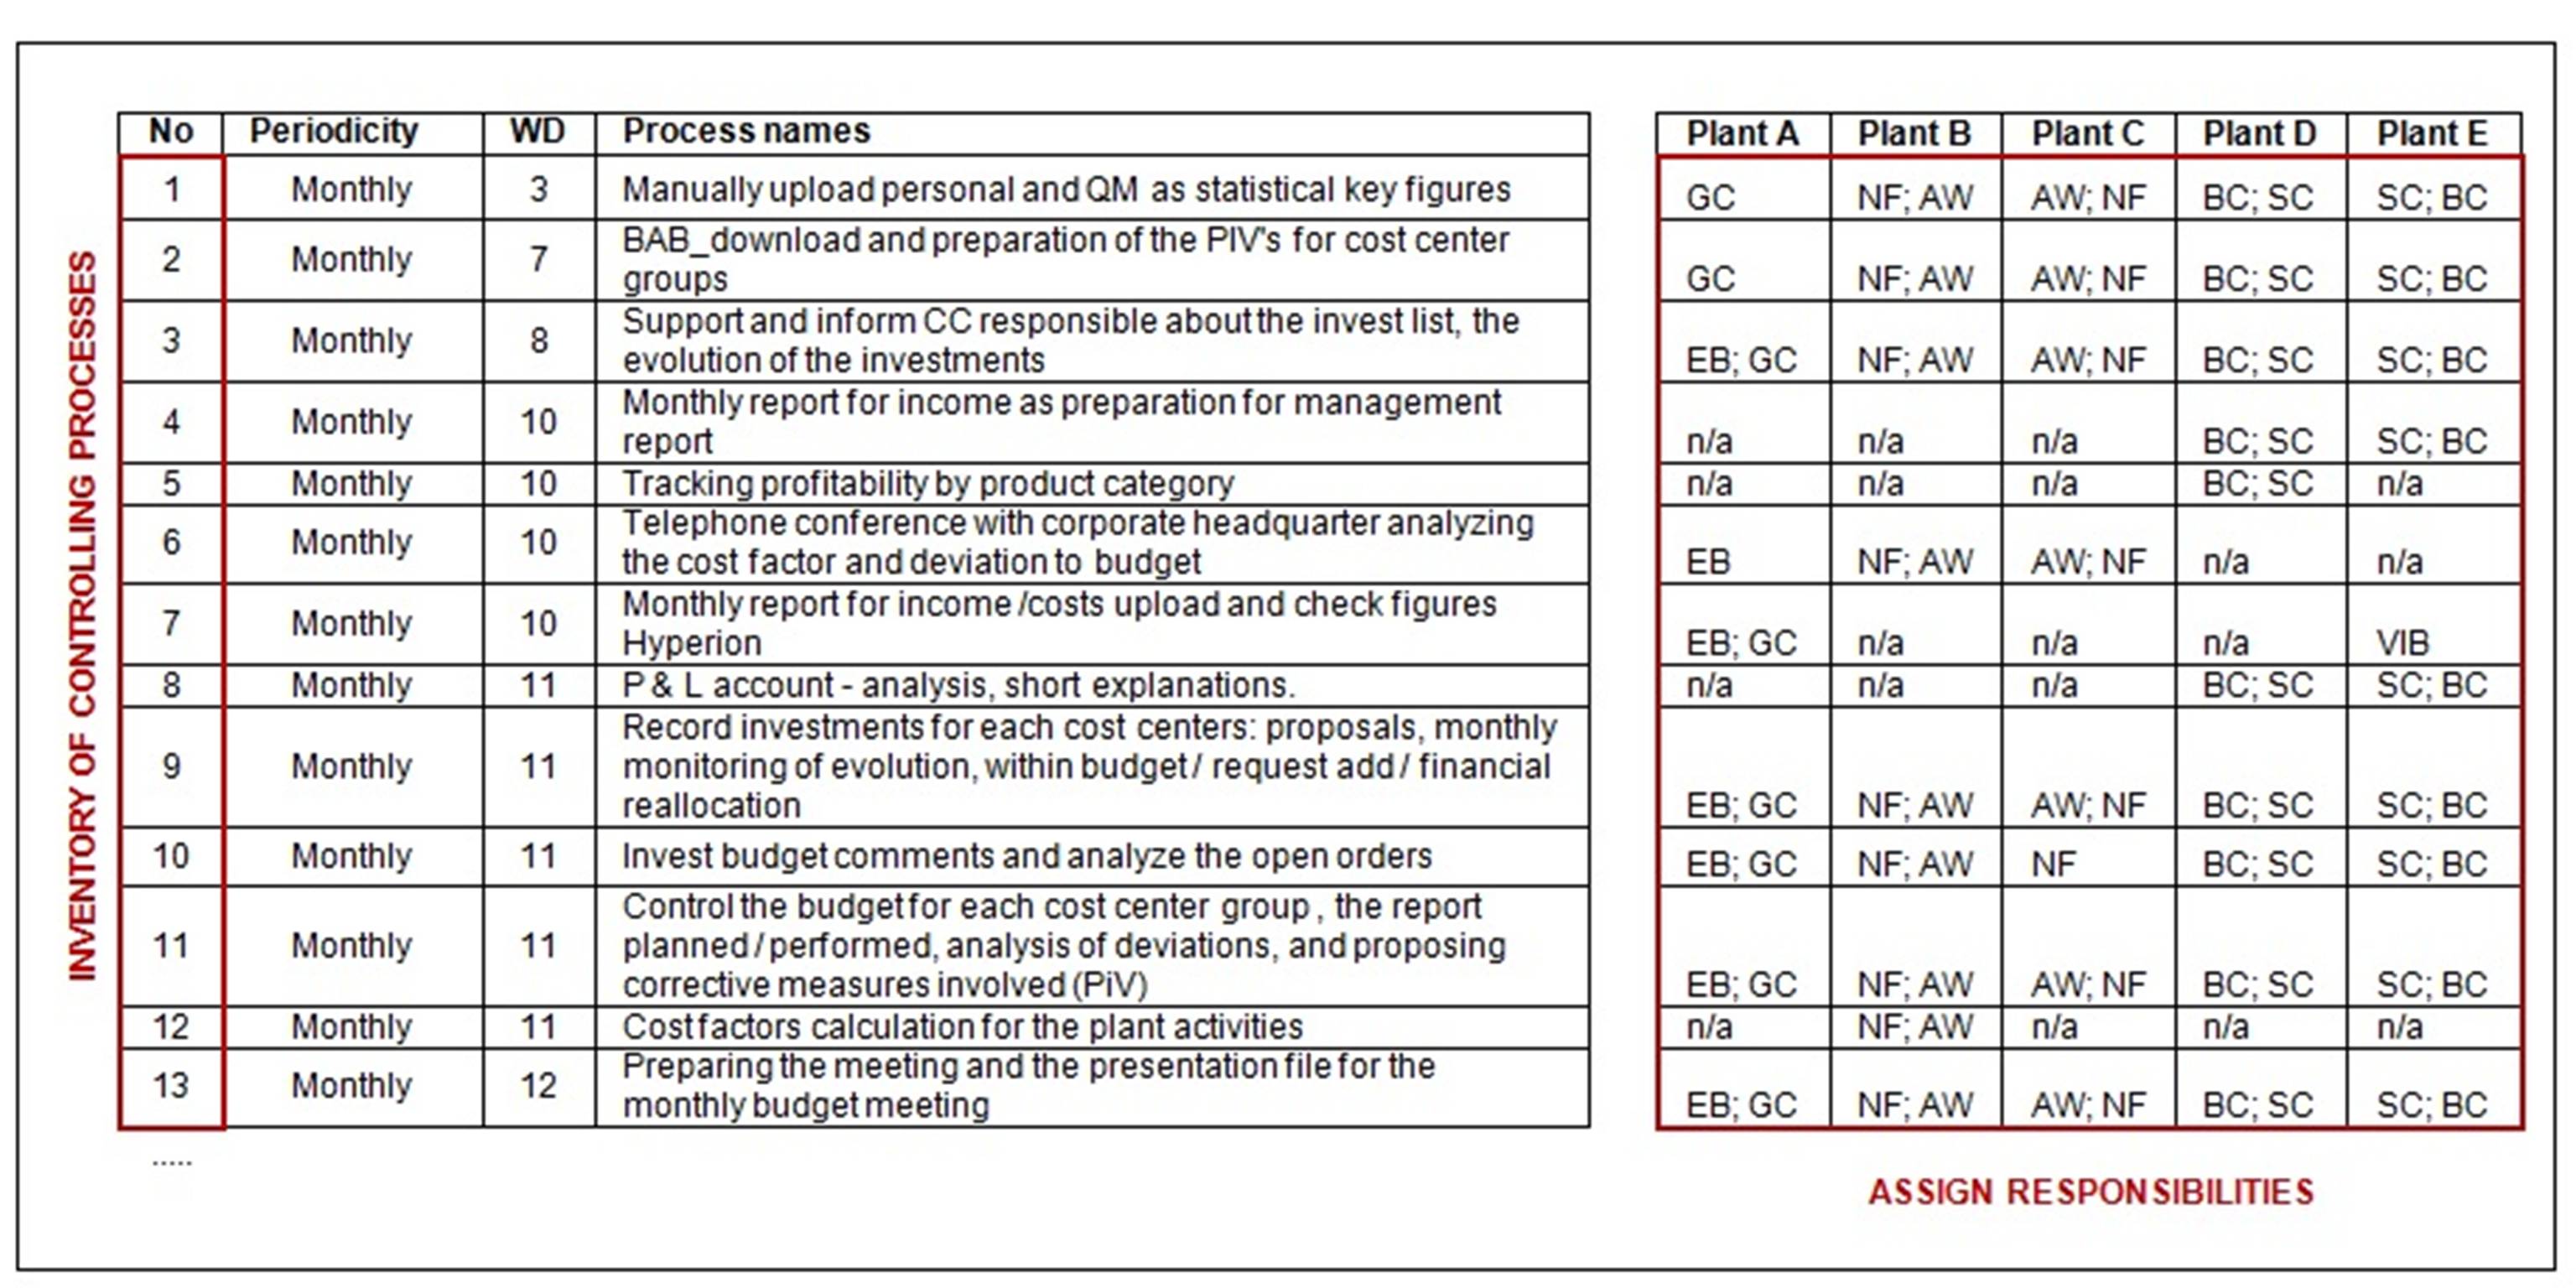
The result of the work was a controlling manual which consists of an inventory of all relevant controlling processes at the five plants:
Figure 13: Inventory of controlling processes
Source: Author´s figure
For this, all controlling processes were inventoried and the periodicity and the due date were documented. The due date here was set as a specific working day of the month. The respective process names can be found in the next column. As the illustrated company structure consists out of five plants, it was important to clarify which processes are relevant for each specific plant. If a process was not applicable for a plant, this was clarified with “n/a”. The responsible person for each process was assigned as well as a backup person was defined. The clear definition of responsible persons and back up persons had the following advantages:
Figure 14: Assign responsibilities
Source: Author´s figure
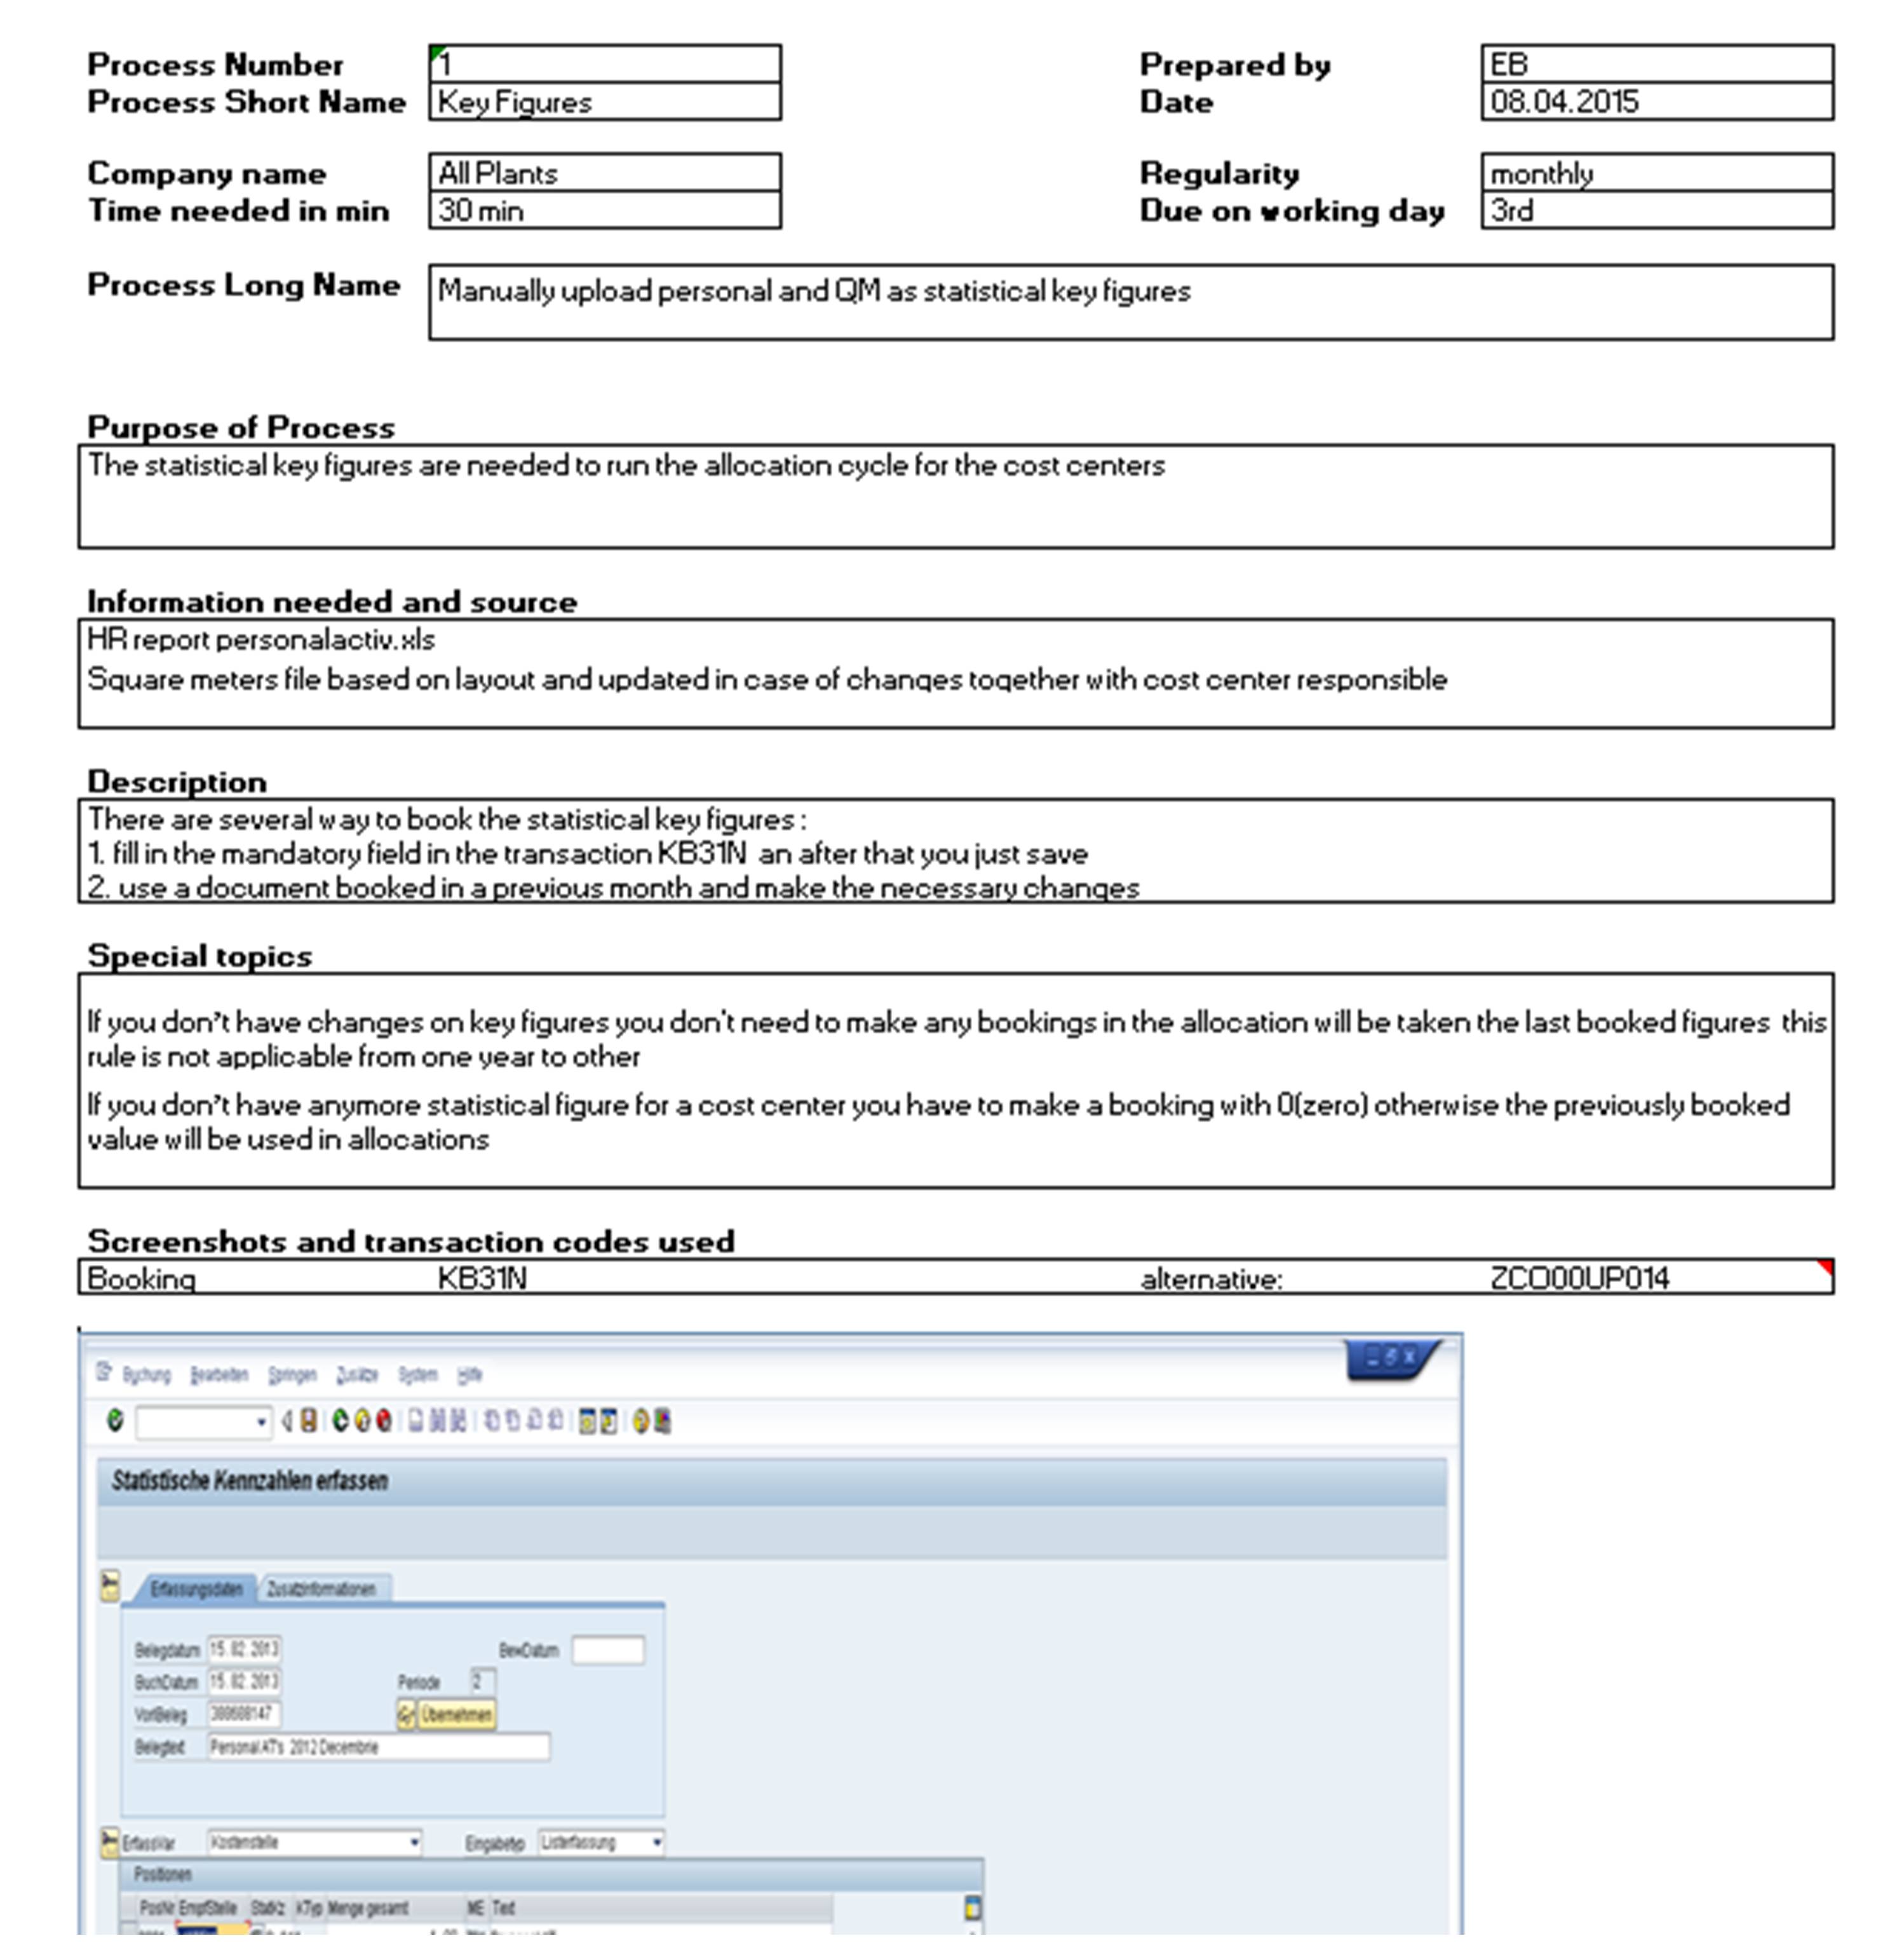
Based on the process inventory, a detailed process description was set up for each process. By doing this, a common process understanding between the five plants could be established and the processes between the plants were harmonized following the best practices. Other goals achieved were to document the process ensuring high process quality in the execution and to establish training material for the on-boarding of new colleagues and as reference for the backup person. To reach these goals, the process goals were clarified and the process execution was documented with screenshots and, if applicable, with SAP transaction numbers. Special topics or potential conflicts were documented in a special field:
Figure 15: Detailed process description
Source: Author´s figure
The improvement project was concluded and 84 relevant controlling processes were identified, documented and the responsibilities including back up responsibilities were clarified.
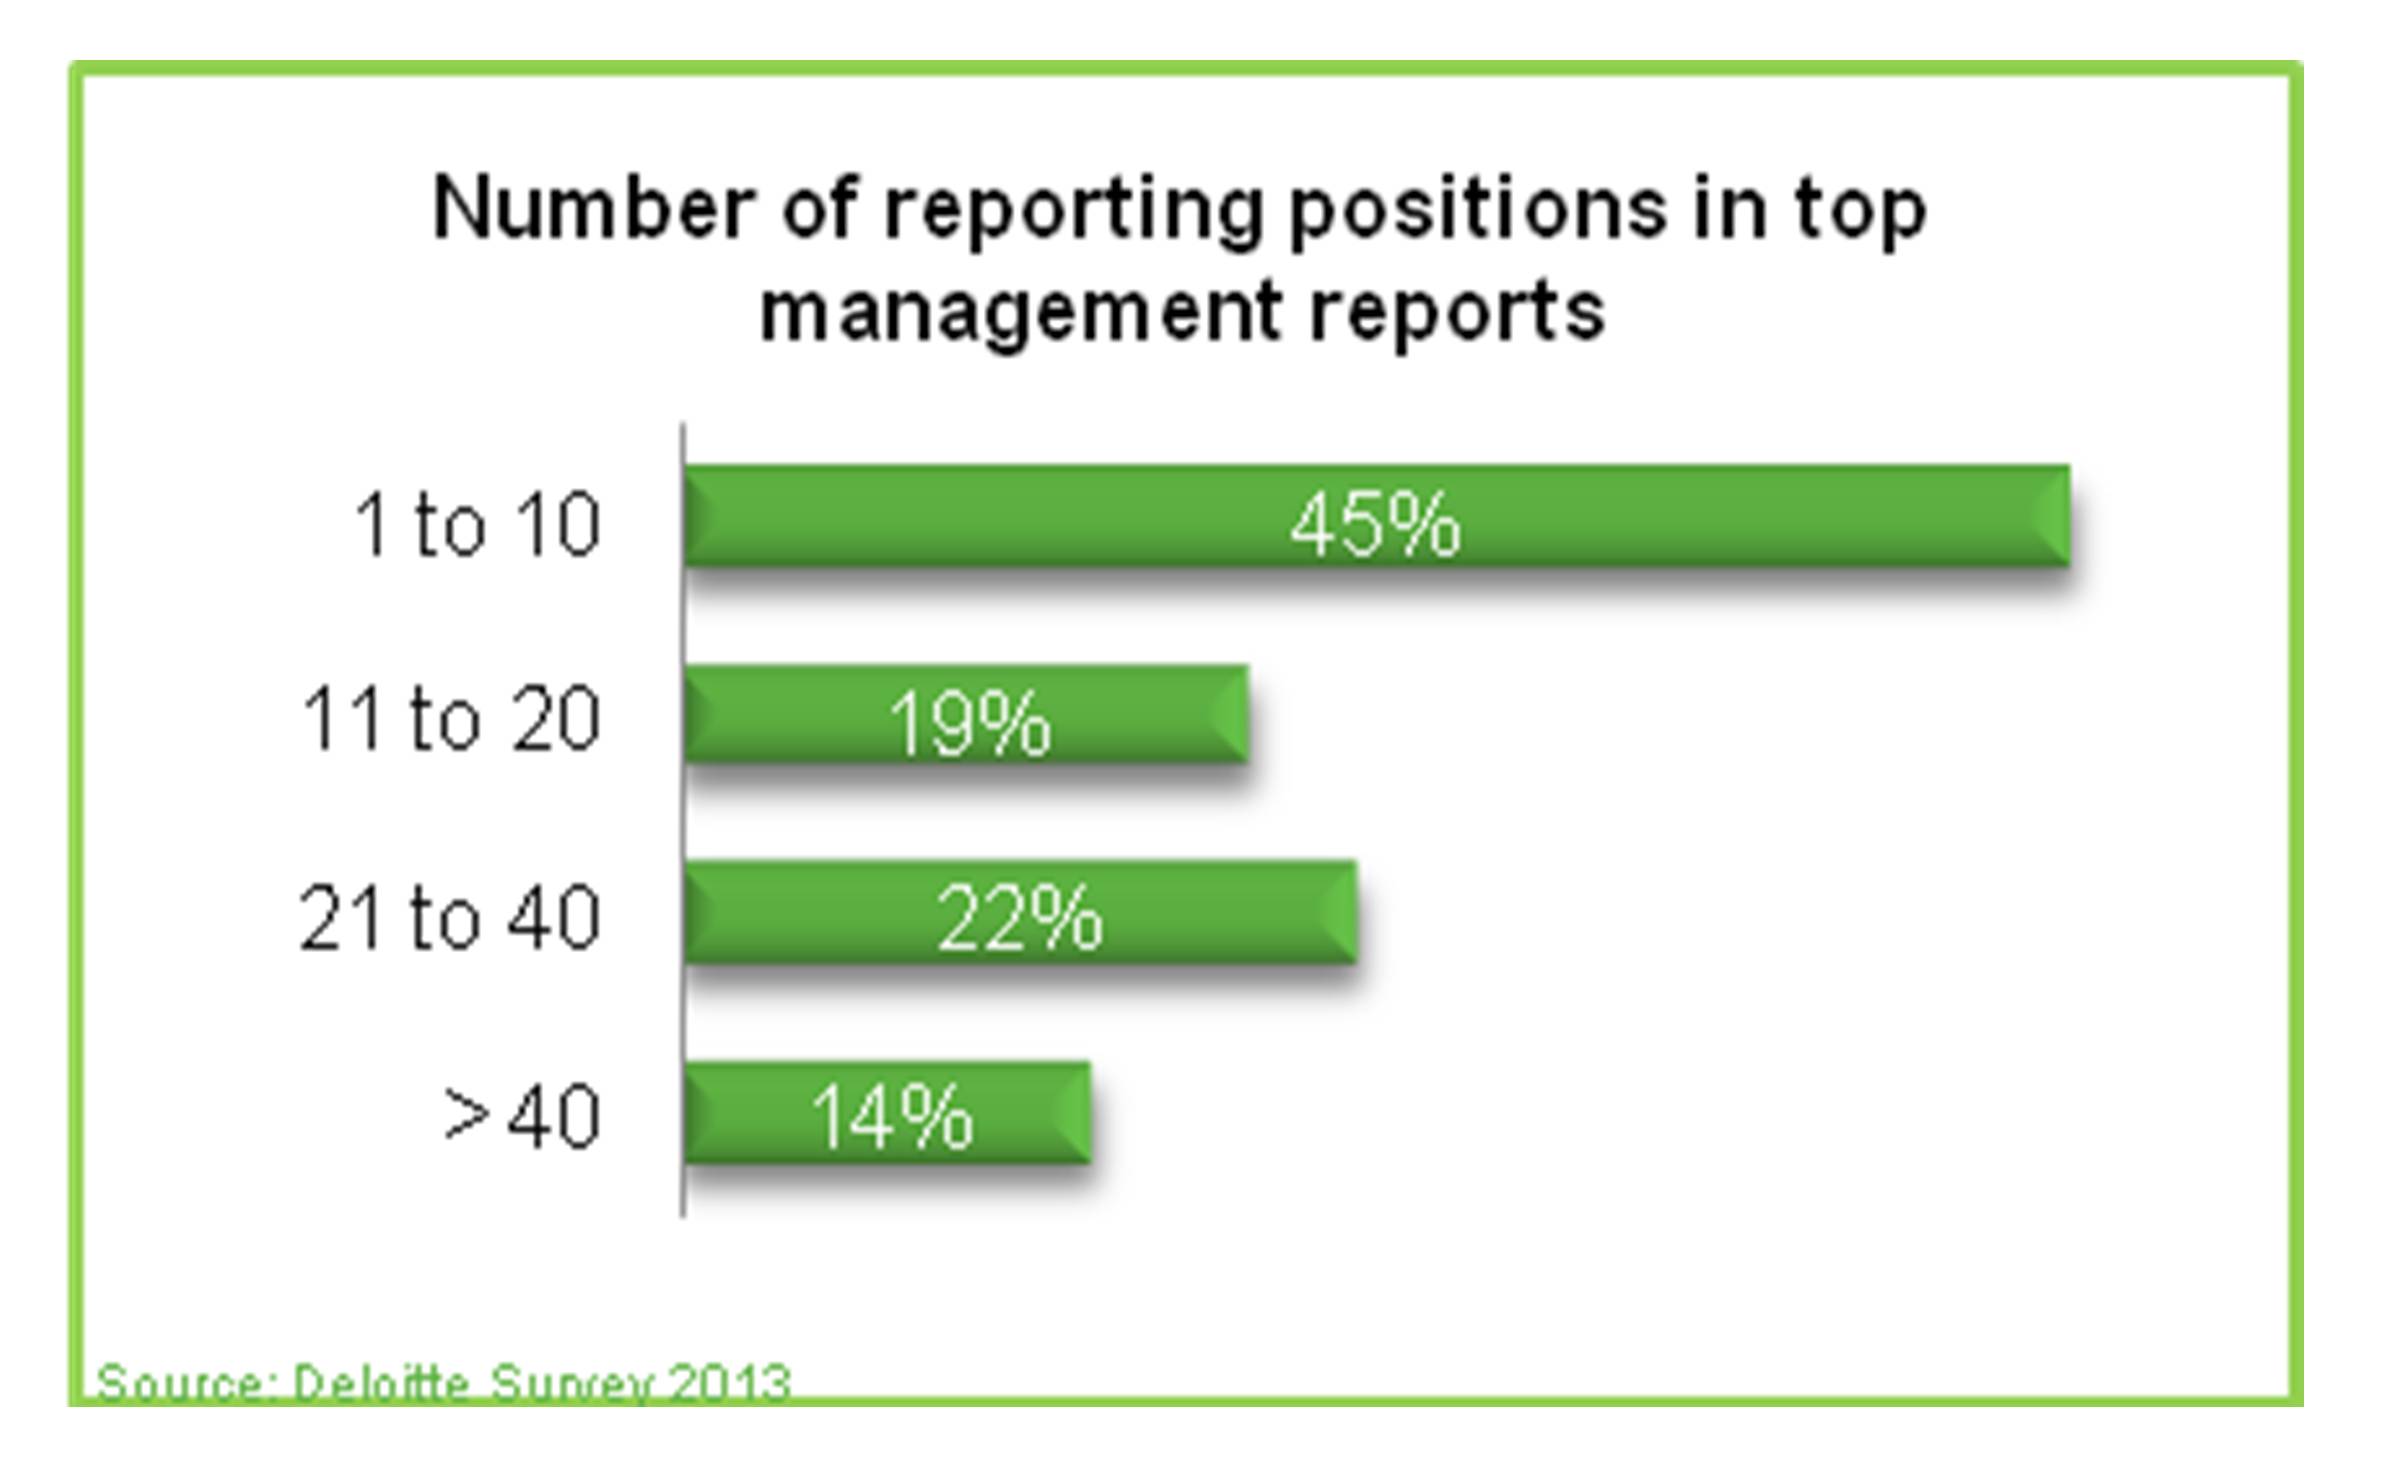
Reporting volume
The number of reporting positions in the author´s survey was significantly higher than in the reference survey. Interesting is an inverse result of both surveys. Only a minority in the author´s survey had short reports with 20 or less reporting positions, while in the reference a majority had short reports. In the author´s survey, 65% (36% in the reference survey) of the reports had more than 21 reporting positions:
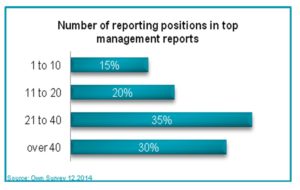 Figure 16: Reporting positions (survey)
Source: Author´s survey
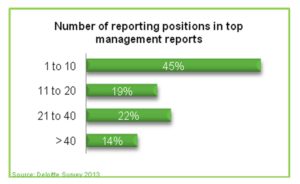 Figure 17: Reporting positions (reference)
Source: Based on Deloitte (2013)
This indicates that the management reporting in the companies of the author´s survey could be streamlined to transport fewer but more significant information. A high number of existing positions and a high intensity of analyzing financial KPI can lead to an increased work load and stress level within the controlling but will not necessarily lead to an increased impact of the controlling (Goeldel, Hanns, 2012). The number of reporting positions was therefore identified as a significant improvement area. The inventory of reporting positions should be regularly reviewed for decision usefulness.
Reporting relevance
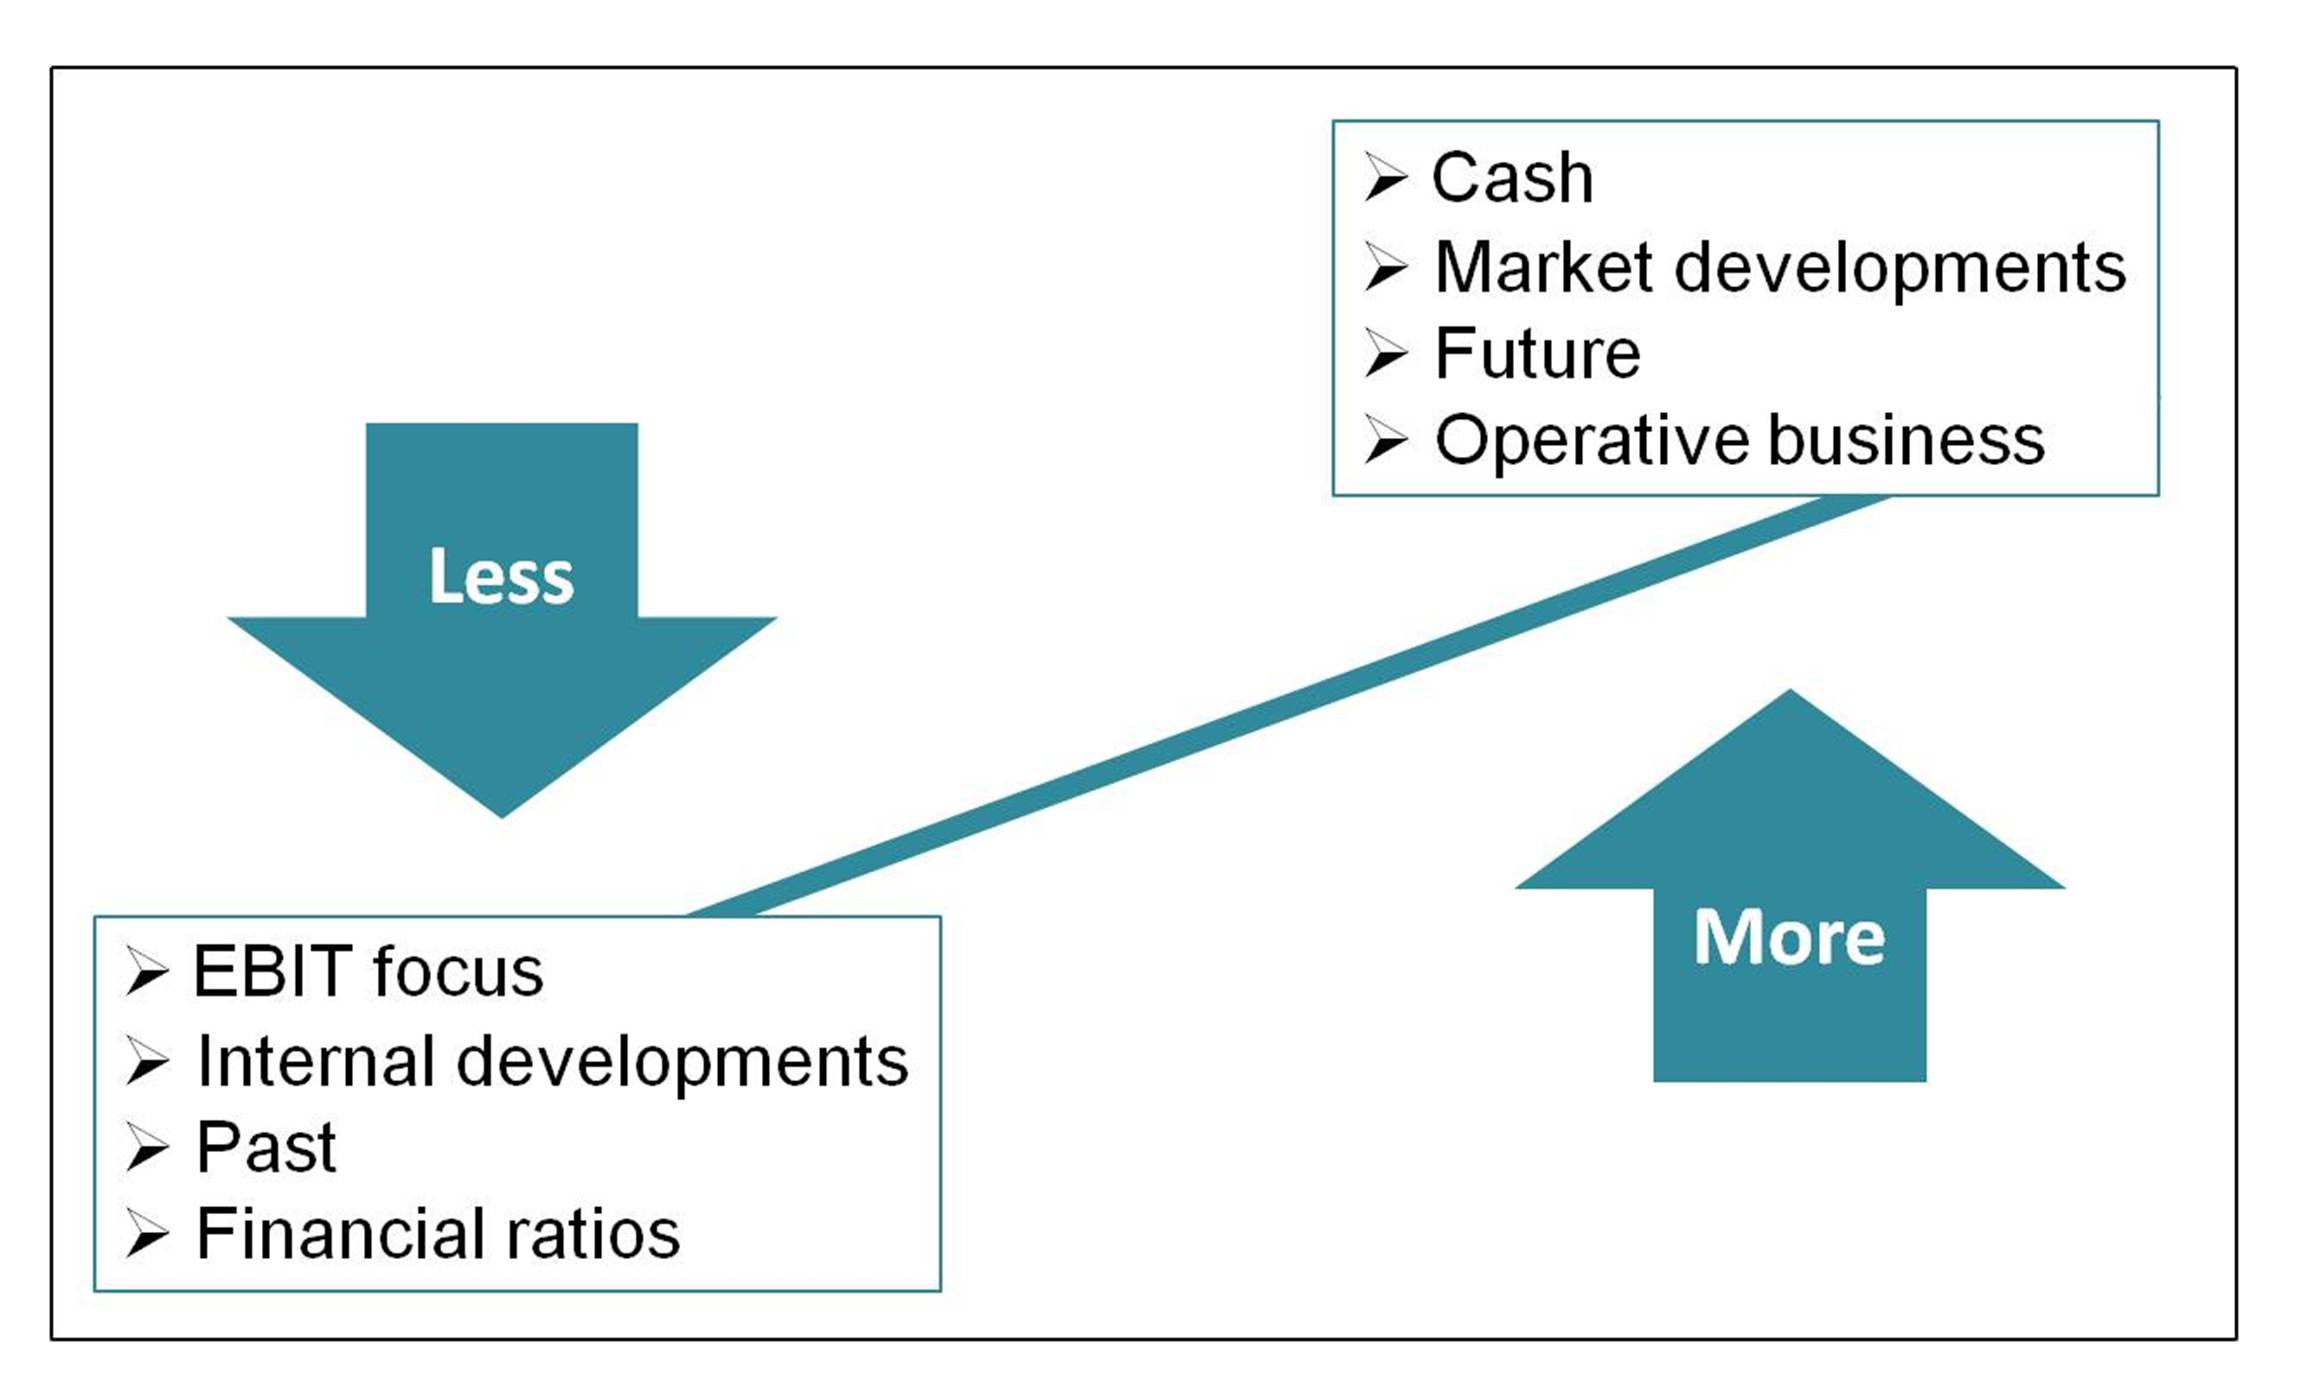
To be effective, the reporting contents need to follow the business requirements. Important is to focus the reporting on key performance indicators related to the business strategy (Baumgärtner, 2014). The decision usefulness of selected key performance indicators will depend on the company business model and on the current situation of the company (Rachfall & Rachfall, 2013). As the times get more volatile or unstable, the traditional key performance indicators seldom deliver the decision support needed for the current questions. To improve the reporting relevance, the management reporting should concentrate on a few decision relevant KPI which relate to cash and market aspects and also include the thinking in scenarios (Goeldel, 2010):
Figure 18: Increasing the effectiveness
Source: Author´s figure following Goeldel (2010)
The reporting should be reviewed regularly if it is in line with the key drivers of the business and if the reporting addresses the right content to the right people, meaning decision relevant information to those who are in the position to make this decision.
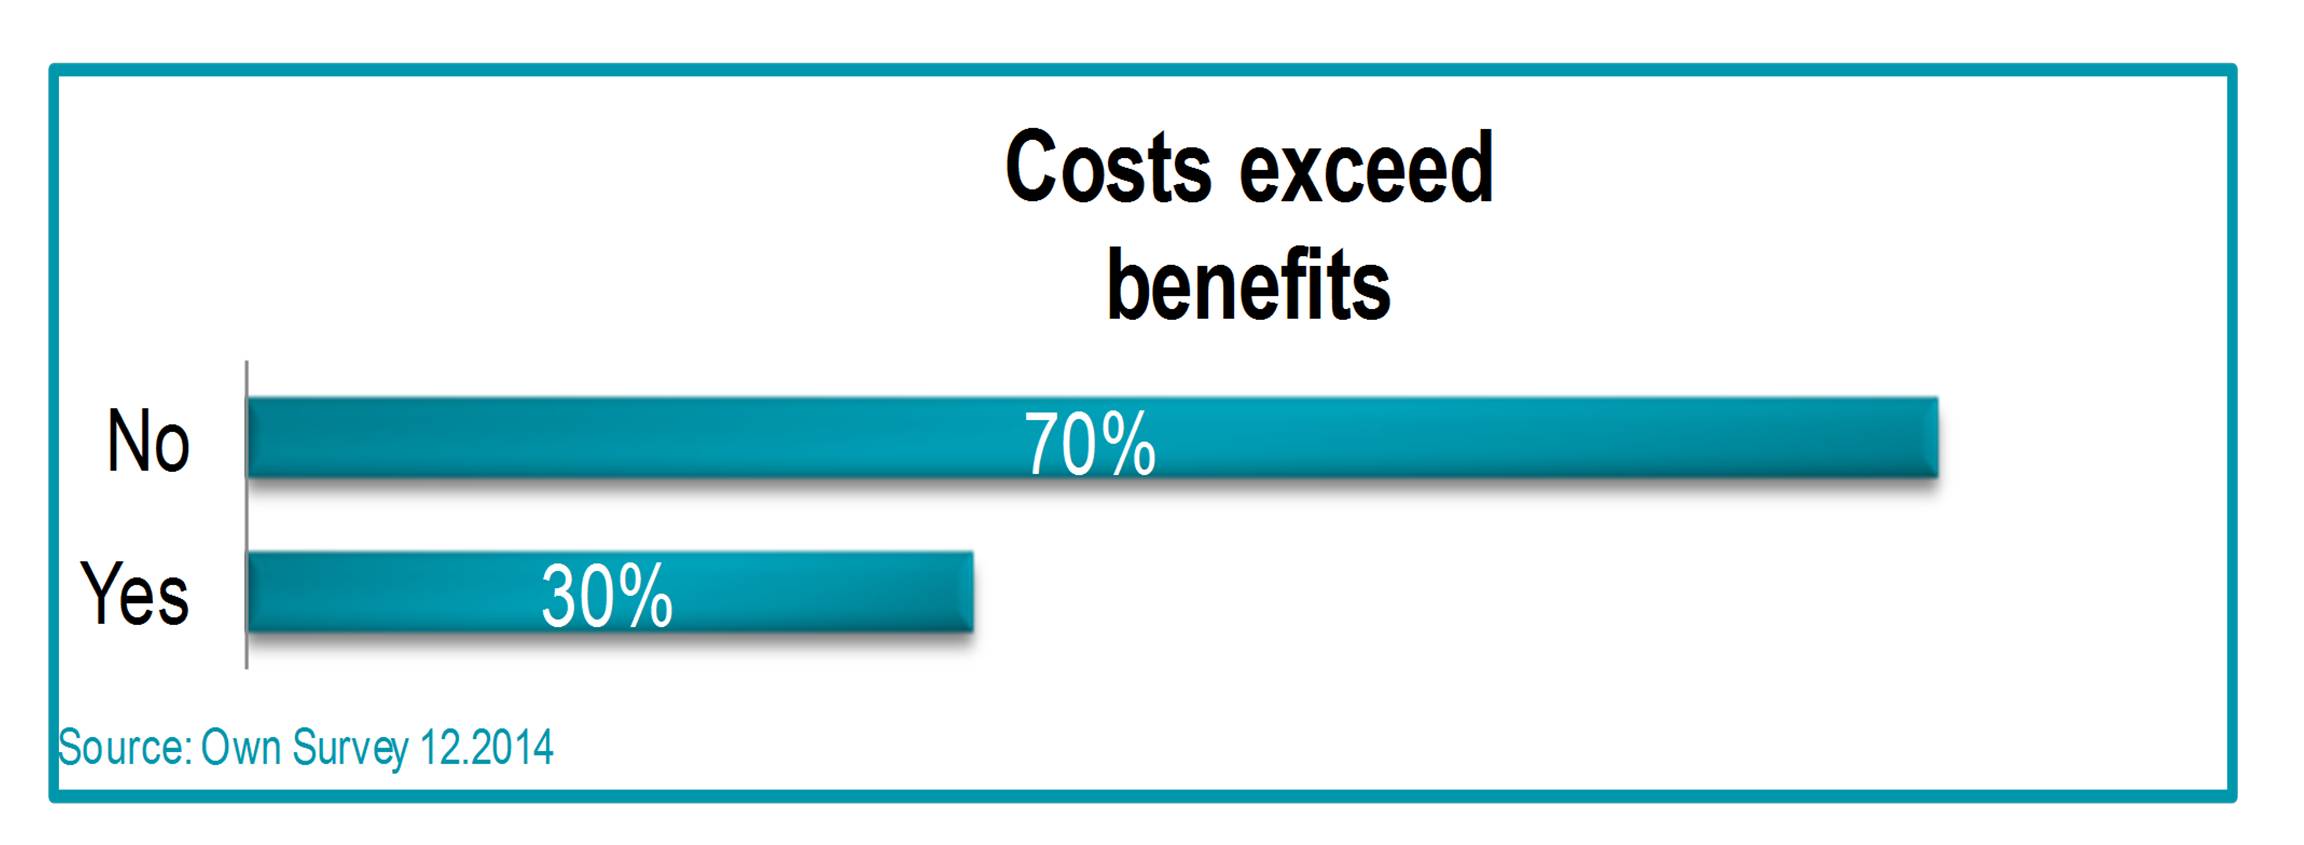
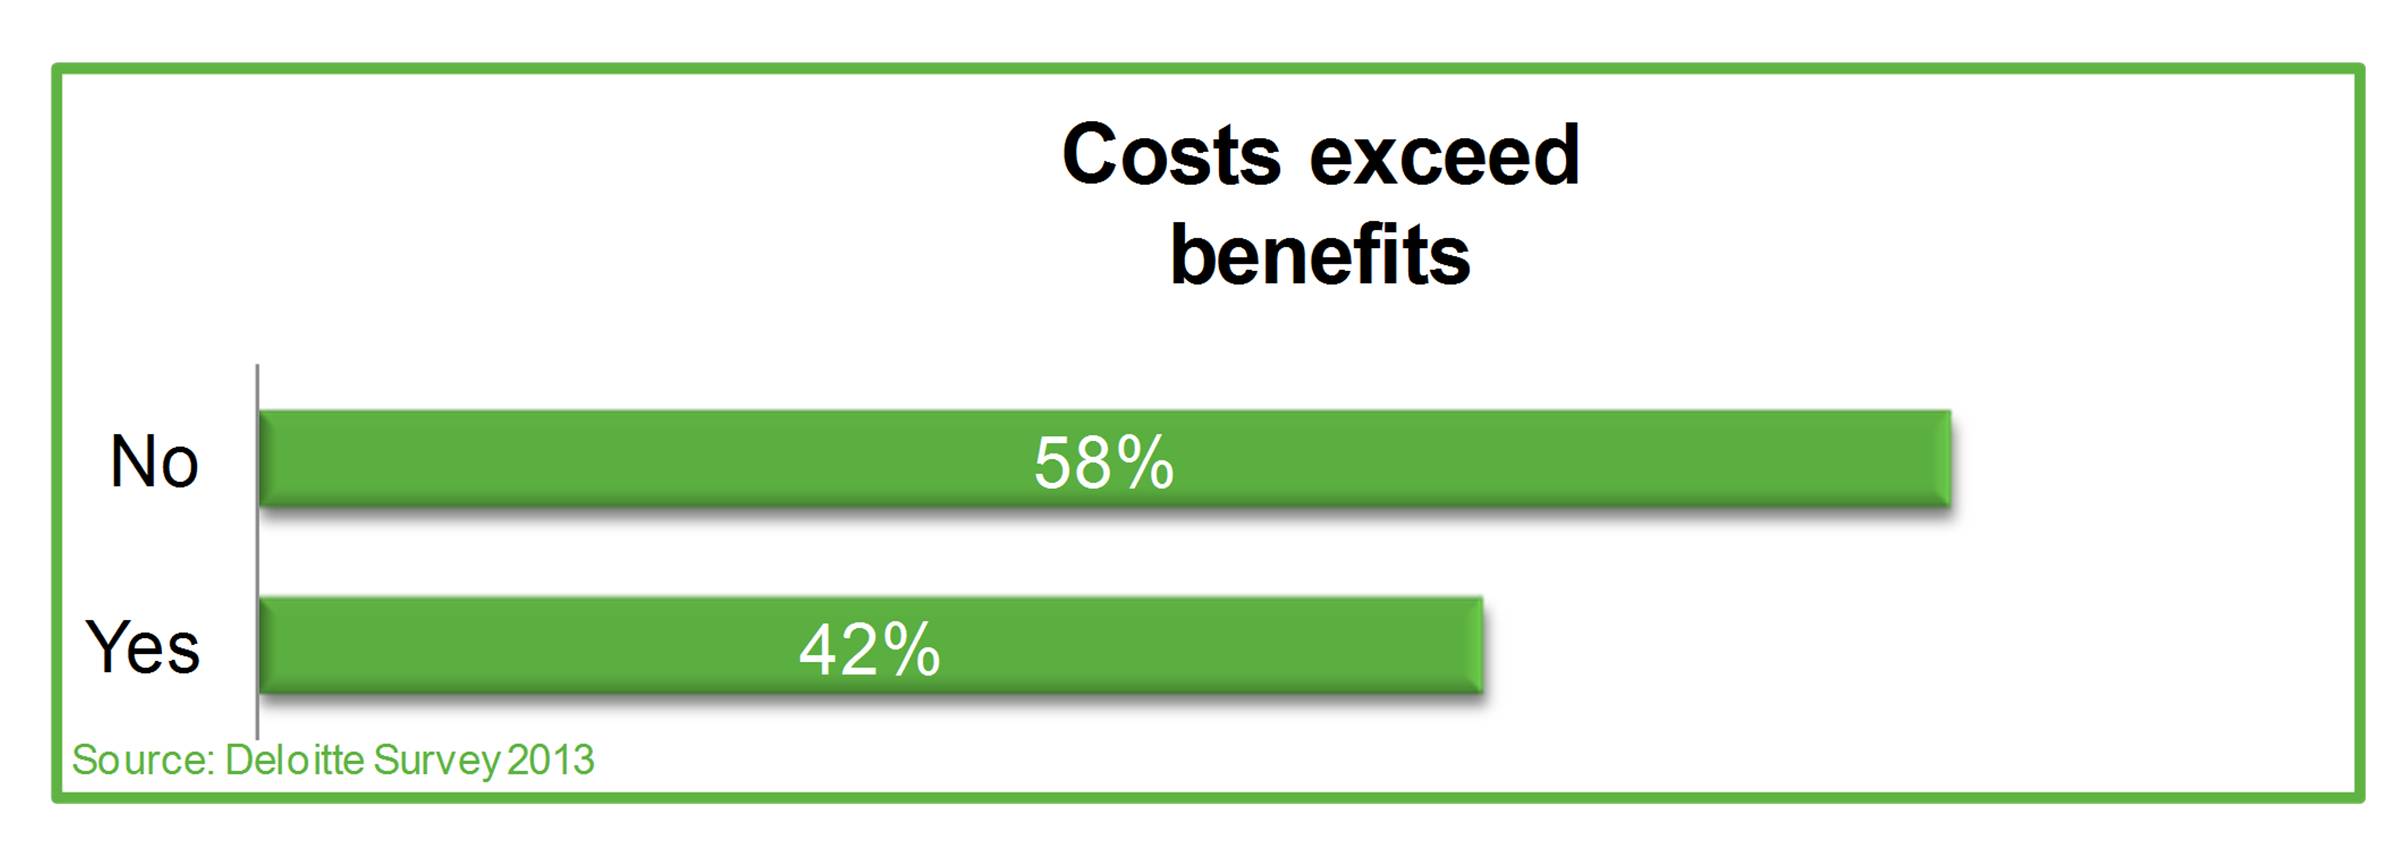
Cost / benefit
In both surveys, approximately 40% of the respondents answered correspondingly that they were not aware of the true costs of the management reporting:
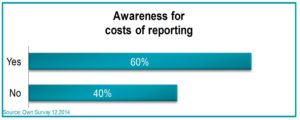 Figure 19: Cost reporting (survey)
Source: Author´s survey
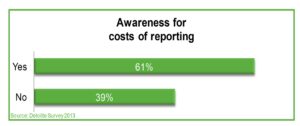 Figure 20: Cost reporting (reference)
Source: Based on Deloitte (2013)
Both surveys also indicate that there were doubts that the cost of the management reporting exceeds the benefits of the reporting. 70% of the participants in the author´s survey (58% in the reference survey) were of the opinion that the costs exceed the benefit of the reporting. These results clearly indicate the need to improve the efficiency and effectiveness of the management reporting:
Figure 21: Costs versus benefits (survey)
Source: Author´s survey
 Figure 22: Costs versus benefits (reference)
Source: Based on Deloitte (2013)
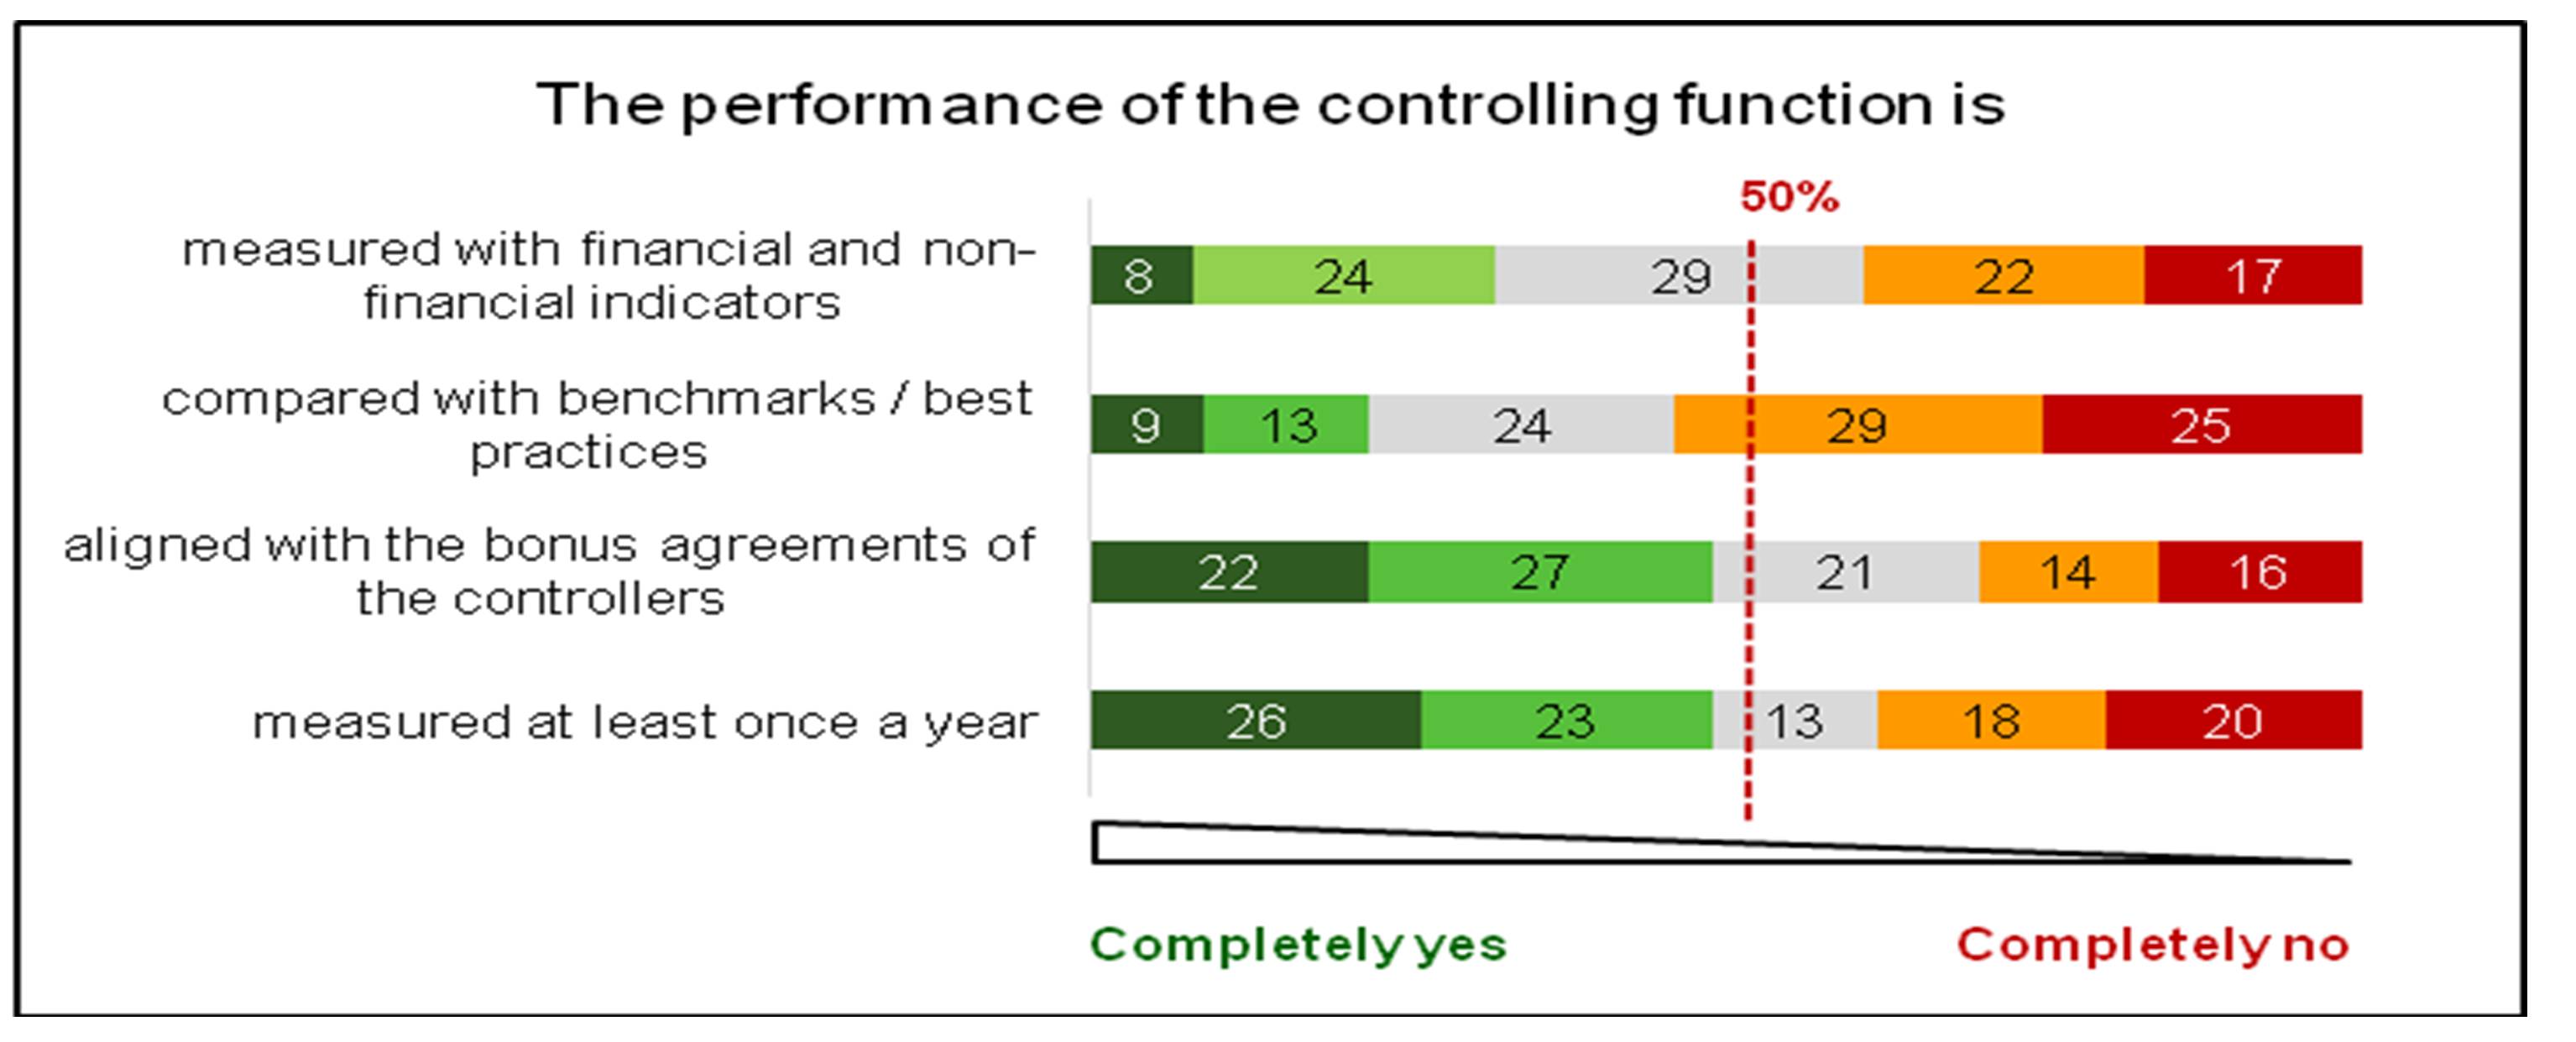
For this improvement, the performance of the management reporting should be tracked and monitored as this is the data basis to increase the performance of the controlling department in the future. Based on a survey from Heimel (2011), the performance of the controlling function is measured in only a minority of companies:
Figure 23: Measuring the performance
Source: Based on Heimel (2011)
The performance of the controlling can be measured using three kinds of indicators. Input indicators relate to the input allocated to the controlling function such as (money, headcount …). Output indicators relate to the quality and relevance of the output such as reports. The third category of indicators are process indicators who give an indication of the efficiency of the controlling processes (International Group of Controlling, 2012):
Figure 24: Measuring controlling performance
Source: Author´s figure
The result of this measuring should be compared with the benchmarks or the best practices to estimate where the controlling function is positioned within its peer group. After the measuring and benchmarking systematic is established, it is recommended to ailing the measuring systematic with the target setting / the bonus regulation of the controllers. This will help to keep the attention of the controller on the continuous improvement of the reporting processes.
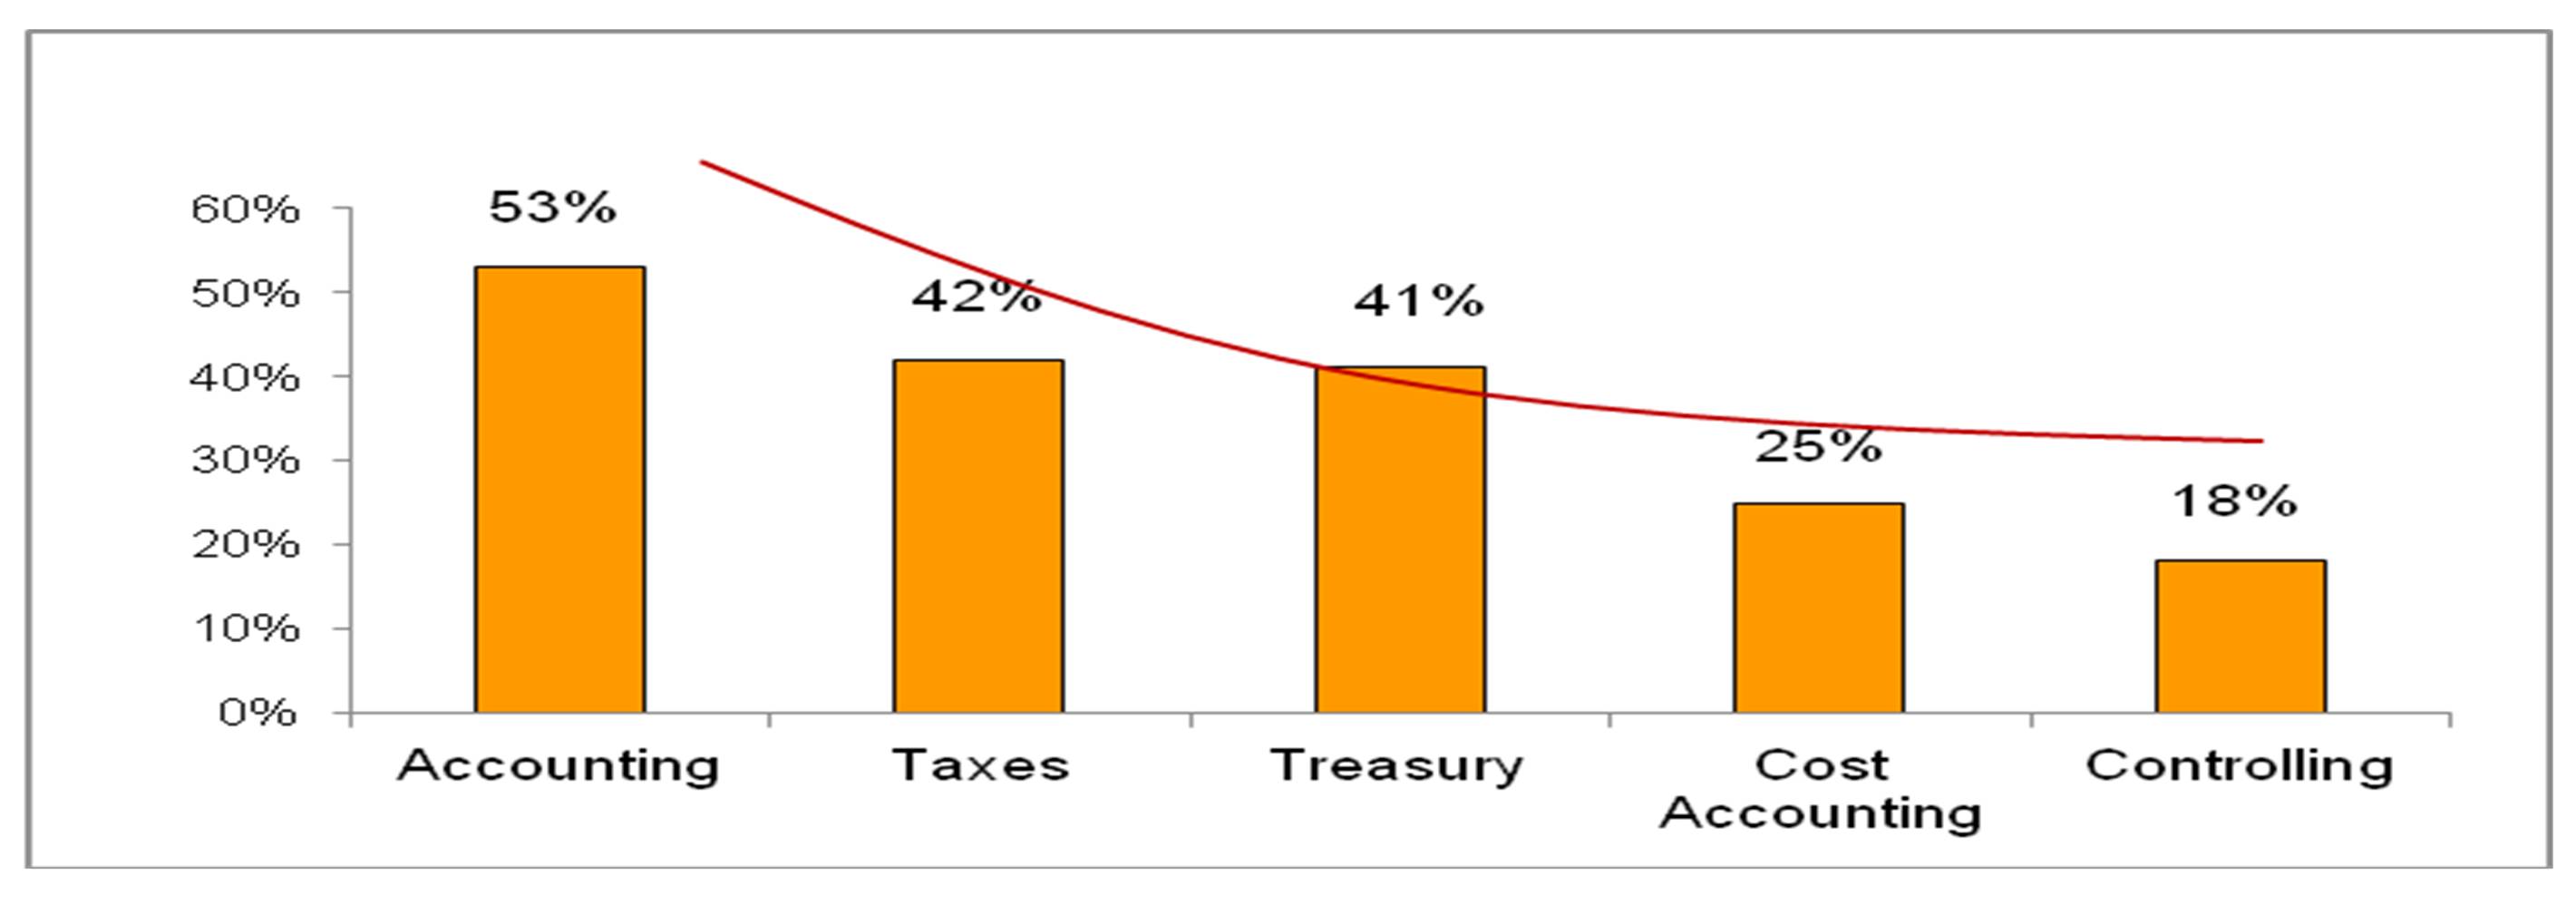
Controlling shared service centers as outlook
The measures discussed above can be implemented on a standalone basis, meaning without considering a big organizational change. Beyond this, a new level for the optimization of reporting processes can be reached by pooling controlling activities in controlling shared service centers (SSC). Based on a survey made by Weber & Gschmack (2012), the usage of SSC has a correlation with the company size and the function analyzed. The bigger the company, the more companies use SSC. The following percentage numbers relate to big companies over 1 bn. EUR sales: Accounting 53%, Taxes 42%, Treasury 41%, Cost Accounting 25% and Controlling 18%.
Figure 25: Popularity of shared service centers
Source: Author´s figure based on Weber & Gschmack (2012)
Regarding the location of the SSC, the mentioned study reveals that 56% of the SSC were located in the country of the corporate center (in this case Germany) and only 9% were located outside the European Union. The triggering aspect for the location of the SSC was the availability of qualified people and the respective salary costs. According to the survey, the physical distance to the corporate center had a lower influence on the decision for location (Weber & Gschmack, 2012).
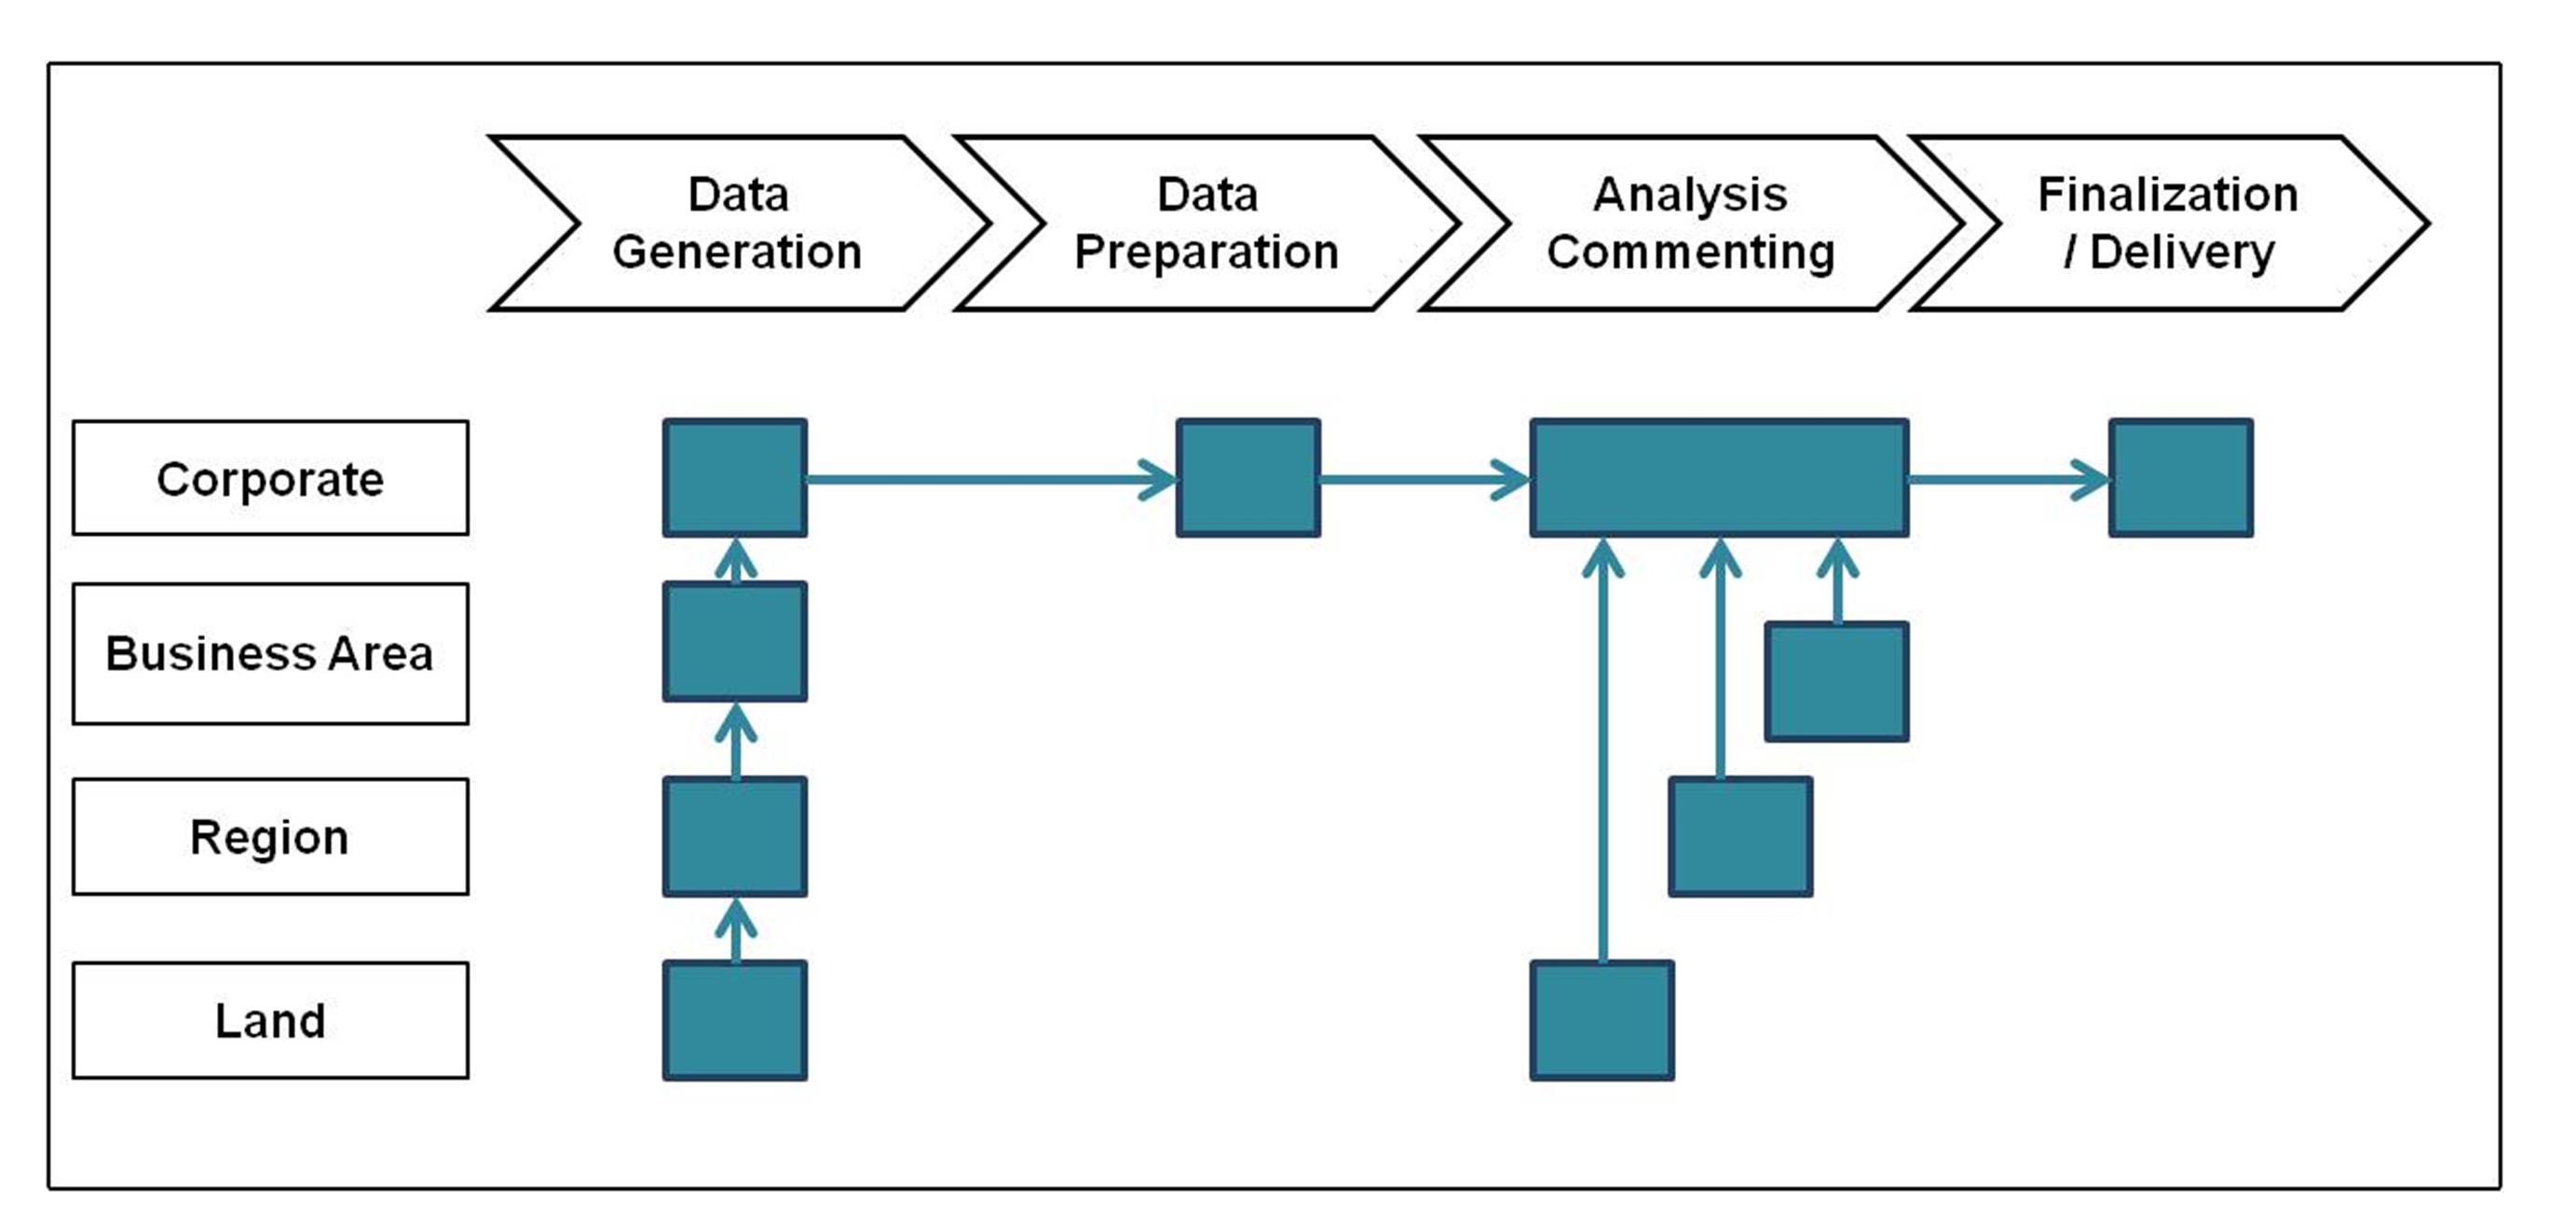
The observed popularity of controlling SSC was with 18% significantly lower than with other finance functions. Arguments for the lower popularity of controlling SSC were that controlling activities were considered to be comparably less standardized in comparison with other financial functions such as the legal requirements driven accounting function. Also, the controlling data were seen as more sensitive and confidential than accounting data because of their business and future orientation (Schäffer, Weber, & Strauß, 2012). These restrictions can be overcome by setting up a “reporting factory”. The reporting factory should clearly separate the following controlling activities: (1) data creation, (2) reporting and (3) analysis and consulting (Kirchberg & Palenta, 2012). A similar approach was suggested by Goltz & Temmel (2014):
Figure 26: Shared service center reporting
Source: Goltz & Temmel (2014)
To implement a shared service concept for financial support functions three different time lines of process standardization can be distinguished: (1) Change-Lift-Drop (=standardization before moving), (2) Lift-Change-Drop (=standardization with moving) and (3) Lift-Drop-Change (=standardization after moving) (Weber & Gschmack, 2012).
The efficiency of the finance functions can be increased by bundling capacity in one SSC and in regional HUB´s. The main chances to increase the efficiency in SSC is based on: (1) standardization of processes, (2) automation and (3) scale effects (Oldiges & Schikor, 2013).
Figure 27: Chances for SSC efficiency
Source: Author´s figure
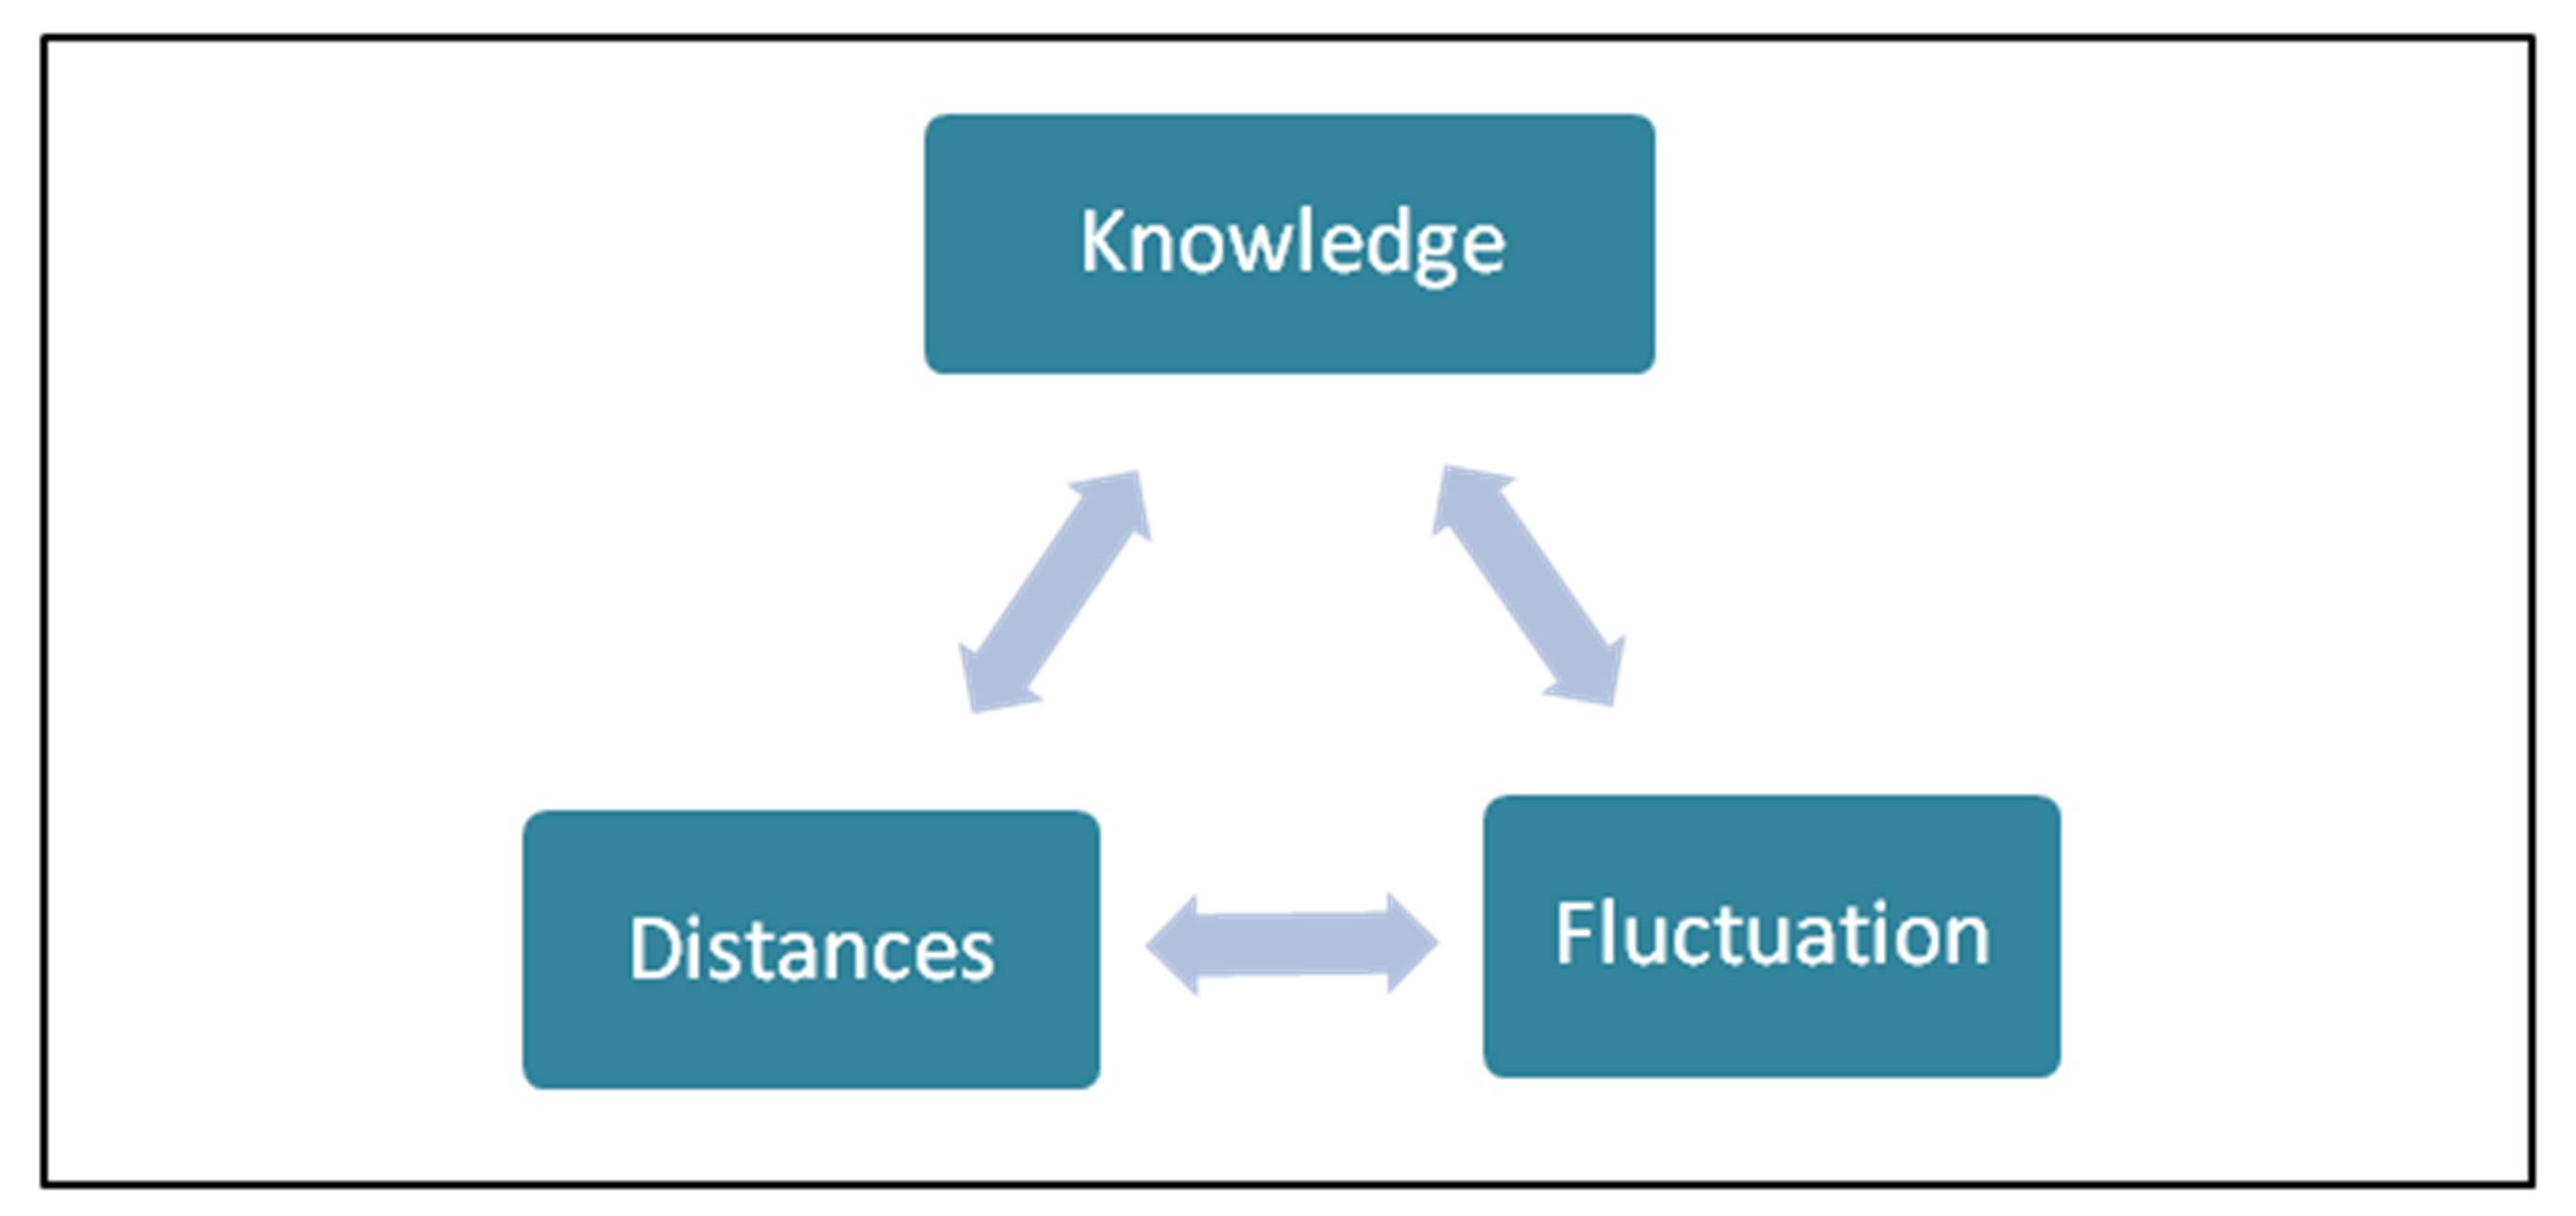
Beside the benefits, three risks on efficiency by off shoring need to be considered: (1) insufficient knowledge of employees in SSC of end to end process; (2) challenge because of detachment and distances reduces the business thinking and (3) the increased fluctuation of employees in SSC (Alebrand, 2013).
Figure 28: Risks for SSC efficiency
Source: Author´s figure
Given the above research, it can be recommended to optimize the reporting content, to improve the efficiency of the report preparation in the given set up and, as third step, to realize further efficiency potentials by implementing a controlling SSC.
Summary and conclusion
Based on a survey and case studies this paper illustrated, how the quality and value contribution of management reporting activities at a global manufacturing company was analyzed, benchmarked and improved. Applying the illustrated benchmarking process, three main improvement areas were further elaborated and improvement steps were outlined:
Figure 29: Cost / benefit
Source: Author´s figure
A major improvement described in this related article is to increase the process efficiency by clear process descriptions and explicit assignment of process responsibilities to individual persons. The article also outlined that the reporting relevance and volume in the survey was a weak point as there were too many reporting elements on the one side with too little reporting relevance on the other side. To improve this observation a consequent review of the reporting content is recommended. The goal of this review is to reduce irrelevant reporting content and to add more steering relevant elements to the reporting package.
The measuring and monitoring of improvement process was crucial for its success. For this, the cost / benefit ratio of the management reporting should be monitored regularly.
The paper closed with an outlook of how further optimization can be reached in a changed company set up using controlling SSC. The paper is expected to have high relevance for multinational companies seeking improvements in their management reporting processes.
(adsbygoogle = window.adsbygoogle || []).push({});
References
1. Alebrand, W. (2013). Offshoring statt Outsourcing. Controlling & Management Review, 57(8), 86–92. http://doi.org/10.1365/s12176-013-0812-4
2. Amann, K., & Petzold, J. (2014). Management und Controlling. Wiesbaden: Springer Fachmedien Wiesbaden. http://doi.org/10.1007/978-3-658-00727-0
Google Scholar
3. Baumgärtner, J. (2014). Unternehmenserfolg greifbar machen – Identifikation und Sterung der Key Performance Treiber durch das Controlling. Controlling : Zeitschrift Für Erfolgsorientierte Unternehmenssteuerung, 26(4/5), 258–263.
4. Deloitte. (2013). Top management reporting Results from a European survey.
5. Goeldel, H. (2010). „Controlling im Unternehmen neu positionieren”. Controlling & Management, 54(1 Supplement), 46–47. http://doi.org/10.1365/s12176-012-0274-0
6. Goltz, E. von der, & Temmel, P. (2014). Die Organisation des Controlling als Hebel zur Integration von Effiziens und Qualitaet. Controlling : Zeitschrift Für Erfolgsorientierte Unternehmenssteuerung, 26(7), 380–385.
7. Heimel, J. (2011). Studie: „Prozessorientiertes Controlling erfolgreich umsetzen“ Einführung.
8. International Group of Controlling. (2012). Controlling Process Model. (Horvath & Partners Management Consultants, Ed.). Freiburg • Berlin • München: International Group of Controlling.
9. Kirchberg, A., & Palenta, F. (2012). Industrialisierung im Controlling. Controlling & Management, (3), 52–57.
Google Scholar
10. Krings, U. (2012). Controlling als Inhouse-Consulting. In U. Krings (Ed.), (p. 245). Wiesbaden: Springer Fachmedien Wiesbaden. http://doi.org/10.1007/978-3-8349-3757-5
Google Scholar
11. Oldiges, N., & Schikor, H. (2013). Wie anpassungsfähig ist Ihre Finanzorganisation? Controlling & Management Review, 57(8), 78–85. http://doi.org/10.1365/s12176-013-0811-5
12. Rachfall, T., & Rachfall, K. (2013). Strategische Kennzahlen in dynamischen Märkten. Controlling & Management Review, 57(6), 60–67. http://doi.org/10.1365/s12176-013-0843-x
Publisher – Google Scholar
13. Schäffer, U., Weber, J., & Strauß, E. (2012). Controlling und Effizienz–Auch ein Controller muss sich rechnen! Controlling & Management, 24(17), 12–16. http://doi.org/10.1365/s12176-012-0637-6
Google Scholar
14. Weber, J., & Gschmack, S. (2012). Zentralisierung von Unterstützungsprozessen: Shared Service Center für finanznahe Funktionen. Controlling & Management, 56(3 Supplemented), 44–51. http://doi.org/10.1365/s12176-012-0642-9
Google Scholar