Introduction
Homocysteine (Hcy) is a sulfur-containing amino acid derived from methionine. In normal animals, Hcy is metabolized rapidly to methionine or cystathionine by either the remethylation pathway or the catalytic pathway (Friedman et al., 2001). The remethylation pathway requires the enzymes methionine synthase and methylenetetrahydrofolate reductase (MTHFR), as well as folic acid and vitamin B12 as coenzymes. The catalytic pathway requires the enzymes cystathionine-β-synthase and cysteine synthase, and vitamin B6 acts as a coenzyme. The kidneys play a major role in Hcy metabolism and clearance (Friedman et al., 2001).
In general, moderate, intermediate, and severe hyperhomocysteinemia (HHcy) are defined by circulating total Hcy plasma levels of 12—30, 31—100, and >100 μmol/l, respectively (Friedman et al., 2001). HHcy occurs for several reasons; these include an inherited cystathionine-β-synthase or methionine synthase deficiency, a single gene mutation of MTHFR T667C, and inadequate dietary intake of folate, vitamin B6, or vitamin B12 (Medina et al., 2000). Men are more commonly affected by HHcy than women because Hcy metabolism is linked to estradiol. Plasma Hcy concentrations also increase with age (Mijatovic et al., 1998). It has been reported that HHcy is related to diseases such as coronary heart disease (Cacciapuoti 2011; Frosst et al., 1995; Humphrey et al., 2008), kidney disease (Friedman et al., 2001), Alzheimer’s disease (Moustafa et al., 2012), and rheumatoid arthritis (Roubenoff et al., 1997). Hcy also induces reactive oxygen species via HADPH activation, resulting in the production of several pro-inflammatory cytokines (Fujiki et al., 2012; Lawrence et al., 2002).
Recent studies suggest that plasma Hcy concentration may be a useful biomarker of cardiovascular or neurodegenerative disease (Humphrey et al., 2008; Moustafa et al., 2012). There have been only a few investigations of plasma Hcy concentrations in dogs (Lee and Hyun, 2012; Rossi Set al., 2008; Trisolini et al., 2008). Rossi et al., reported that HHcy was a potential biomarker of cardiac and renal disorders in dogs. However, Lee and Hyun (2012) concluded that there were no significant differences in the plasma Hcy concentrations of dogs in different stages of mitral valve insufficiency. In this study, we provide fundamental data about normal plasmaHcy concentrations and evaluate the relationship between plasma Hcy concentrations and common diseases in a large population of dogs.
Material and Methods
Dogs
A total of 972 dogs were studied. Five hundred of these were male, with a mean age of 6.9 ± 0.2 years (first quartile-median-third quartile 3-7-10 years, range: 0—17 years), and 472 were female with a mean age of 7.1 ± 0.2 years (first quartile-median-third quartile 3-7-11 years, range: 0—17 years). Informed consent was obtained from their owners prior to sample collection. Because blood samples were collected during veterinary examinations, pre-collection fasting time and the time of blood collection were not controlled. However, neither the time of blood collection nor prior food consumption influence plasma Hcy concentration (Fokkema et al., 2003). Blood was collected into ethylenediaminetetraacetic acid (EDTA) 2K tubes (Neotube®, NIPRO, Osaka, Japan) and centrifuged immediately for 15 minutes at 4°C and 1500 × g. The plasma was then transferred to plastic tubes and stored at -20°C until analysis. At the time of sample collection we also recorded the signalment of the donor dogs, including their sex, age, breed, spay/neuter status, and information about the type of diet they received (commercial pet food, home-made food, both, or a therapeutic diet prescribed by a veterinarian).
According to diagnoses provided by the veterinarians of the seven veterinary hospitals in Kagoshima Japan, we classified the dogs into the following groups:
- Control: healthy dogs that presented for a routine health check or spaying or neutering. At the time of sample collection, these dogs had no clinical symptoms (91 males, 96 females, mean age 4.2 ± 0.3 years).
- Heart Disease: dogs with mitral insufficiency, tricuspid insufficiency, or pulmonary hypertension (78 males, 65 females, median age 12 years, mean age 10.9 ± 0.3 years).
- Inflammatory Disease: dogs with non-allergic dermatitis, enteritis, pancreatitis, or pyometra (35 males, 36 females, median age 8 years, mean age 8.6 ± 0.5 years).
- Bone and Joint Disease: dogs with fractures, joint disorders, or intervertebral disc displacement (13 males, 14 females, median age 8 years, mean age 8.4 ± 1.1 years).
- Nervous System Disease: dogs diagnosed with epilepsy, hydrocephalus, or cognitive dysfunction (13 males, 16 females, median age 11 years, mean age 10.2 ± 1.0 years).
- Neoplastic Disease: dogs with lymphoma, mammary tumors, mast cell tumors, leukemia, or bone sarcomas (33 males, 36 females, mean age 10.9 ± 0.4 years).
- Skin Disease: dogs with dermatitis (11 males, 5 females, mean age 9.3 ± 0.8 years).
- Kidney Disease: dogs with chronic kidney insufficiency or renal hypoplasia (6 females, mean age 12.5 ± 2.4 years).
This study was approved by the clinical test executive committee at the Kagoshima University veterinary hospital (KV0005).
Quantification of Homocysteine
Ultra fast liquid chromatography (Prominence UFLC, Shimadzu, Kyoto, Japan) was used to measure plasma total Hcy concentrationsas described previously (Trisolini et al., 2008). The mobile phase was 0.05 mol/l potassium dihydrogenphosphate (Nacalai, Kyoto, Japan), pH 1.9, containing 30 ml/l acetonitrile (Merck, Damstadt, Germany) at a flow rate of 1.0 ml/min. The stationary phase (Chromolith® Column No.UM8125/004, Merck) was at 40°C. The excitation wavelength was 385 nm and the fluorescence wave length was 515 nm. N-acetyl-L-cysteine (NAC, Wako, Osaka, Japan) was added to all samples as an internal standard. A calibration curve for Hcy was constructed using the Hcy/NAC peak area ratios. Concentrations of DL-Hcy (WAKO) standards were 0, 5, 10, 20, 40, 80, and 160 μmol/l. In the presence of NAC, the mean recovery of Hcy dissolved in water and added to plasma to final concentrations of 2.5—40.0 μmol/l was 94% (n=6).
Statistics
Statistical analyses were performed using the Statistical Package for the Social Sciences ver. 19.0 (Chicago, IL) and JMP ver. 9.0 (SAS, Cary, NC). One-way ANOVA was used to perform multiple comparisons. When significant differences were detected, we then compared each pair of groups using the Wilcoxon rank sum test. This non-parametric test was used because the Hcy concentrations were not normally distributed within groups. The correlation between Hcy concentration and age was evaluated using Pearson’s correlation coefficients. To investigate the associations between plasma Hcy concentrations and disease, we compared the plasma Hcy concentration of the control group to the plasma Hcy concentration of each of the disease groups using the Wilcoxon rank sum test. Multivariate logistic regression was used to assess the relationship between Hcy concentration and disease risk. P<0.05 was considered statistically significant.
Results and Discussion
Age and Homocysteine Concentration
Plasma Hcyconcentrations are not generally influenced by general diet. Hcy is an intermediate substance biosynthesized from methionine, and most commercial pet foods have similar methionine content. In the present study, we compared the plasma Hcy concentrationsof dogs fed different types of diets and found no significant differences among dogs that ate commercial pet food, home-made food, both, or a therapeutic diet. There was a significant relationship between age and plasma Hcy concentrations in both male and female dogs, with Pearson’s correlation coefficients of 0.097 (p<0.05) and 0.107 (p<0.05), respectively;however, these correlation coefficients are so low as to be meaningless.
Sex and Homocysteine Concentration
The mean plasma Hcy concentrations of the male and female dogs were 16.1 ± 0.6 μmol/l (first quartile-median-third quartile 10.1-13.7-19.1 μmol/l, and min-max 3.2—50.1 μmol/l) and 15.2 ± 0.5 μmol/l (first quartile-median-third quartile 9.3-12.9-17.4 μmol/l, and min-max 2.4—62.8 μmol/l), respectively. Although the difference in the plasma Hcy concentrations of male and female dogs was small, it was statistically significant (p=0.0351). Human epidemiologic studies have also shown a relationship between Hcy and sex (Rasmussen et al., 1996). There was no difference between the plasma Hcy concentrations of neutered and intact male dogs;however, the plasma Hcy concentration of spayed females was significantly higher than that of both intact females (p=0.0002) and males (p<0.0001) when analyzed using the Wilcoxon rank sum test. The spayed females (n=233) had a mean plasma Hcy concentration of 16.8 ± 0.7 μmol/l (first quartile-median-third quartile 10.1-14.0-19.9 μmol/l, and min-max 2.8—62.8 μmol/l). Intact females (n=257) had a mean plasma Hcy concentration of 9.4 ± 0.6 μmol/l (first quartile-median-third quartile 8.5-11.9-16.1 μmol/l, and min-max 2.4—89.5 μmol/l). It has been reported that plasma Hcy concentration tends to increase after menopause in humans, and treatment with 17 β-estradiol—dydrogesterone decreases plasma Hcyconcentrations in postmenopausal women (Mijatovic et al., 1998). Trisolini et al., (2008) also reported that the plasma Hcy concentrations were significantly elevated in spayed canines (Trisolini et al., 2008). Our results, and the results of these other studies, certainly indicate that Hcy metabolism is regulated by female hormones in both humans and canines.
Breed and Homocysteine Concentration
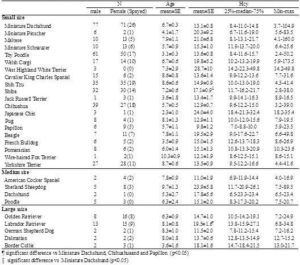
Breed-specific plasma Hcy concentrations are summarized in Table 1. Breeds are only listed in Table 1 if samples were obtained from 3 or more animals of that breed. Plasma Hcy concentrations differed significantly among breeds (one-way ANOVA, p=0.0048). Between-breed comparisons were performed using the Wilcoxon rank sum test, which showed that Labrador Retrievers had significantly higher plasma Hcy concentration than Miniature Dachshunds (p=0.0014), Chihuahuas (p=0.0225), and Papillons (p=0.0134). The plasma Hcy concentration of ShibaInu was also significantly higher than that of Miniature Dachshunds (p=0.0022). The differences were not related to age. It has been reported that, in humans, moderate HHcy is partially associated with genetic factors, such as a single nucleotide polymorphism of MTHFR (Medina et al., 2000). The differences in plasma Hcy concentrations among canine breeds might be the result of genetic factors associated with Hcy metabolism. Additionally, these results should be interpreted with caution because the study population included many diseased dogs.
Table 1. Plasma Hcy Concentration in Each Breed
Disease and Homocysteine Concentration
Dogs in the heart disease, neoplastic disease, kidney disease, and skin disease groups had significantly higher plasma Hcy concentrations than control dogs. However,multivariate logistic regression analyses adjusted for age, sex, and spay/neuter status revealed that Hcy concentration was only associated with skin disease when these other variables were included in the model. The odds ratio per 1 μmol/l increase in Hcy was 1.077, 95% confidence interval (CI) 1.001—1.158, p<0.05. In the control group (n=187), the mean plasma Hcy concentration was 13.5 ± 0.4 μmol/l (first quartile-median-third quartile 9.6-12.8-16.0, and min-max 4.3—50.1 μmol/l). In the skin disease group (n=16), the mean plasma Hcy concentration was 20.3 ± 2.3 μmol/l (first quartile-median-third quartile 13.8-19.3-23.3, and min-max 9.7—49.8 μmol/l). The skin disease group included five Shih Tzus and 11 other dogs of nine different breeds. However, our finding that Hcy concentration was associated with skin disease should be interpreted with caution because there were no precise guidelines for diagnosing skin disease; in some cases dogs were classified as having skin disease even without evidence of dermatitis. Thus, further studiesare needed to conclude that HHcy is related to skin disease. Husemoen et al., (2006) studied the association between HHcy and atopy. They reported that the risk of atopywas related to an MTHFR polymorphism (C677T). The TT genotype had a significantly higher risk of atopy than the CC and CT genotypes (odds ratio = 1.76, 95% CI 1.19—2.60). However, total homocysteine concentration was not related to atopy (odds ratio per 5mmol/l 1.12, 95% CI 0.98—1.29). They concluded that impaired folate metabolism may underlie the development of atopy. There are, however, many papers that suggest that Hcy stimulates the immune system via NF-κB activation (da Cunha et al., 2010). Schroecksnadel et al., reported that Hcy accumulation is induced in the culture medium of stimulated peripheral blood mononuclear cells (Schroecksnadel et al., 2003). Rossi et al., (2008) reported that Hcy is a useful biomarker of canine renal disorders. We did not find a relationship between Hcy concentrations and kidney disease in this study, perhaps because the number of dogs with kidney disease in our study was small. Whether HHcy is related to mitral insufficiency is unclear in the literature (Lee et al., 2012; Rossi et al., 2008). Multivariate logistic regression analysis of our data showed no significant relationship between heart disease and plasma Hcy concentration.
Conclusion
Our results suggest a novel relationship between canine plasma Hcy concentration and skin disease. Plasma Hcy concentrations were highest in ShibaInu and Labrador Retriever dogs.
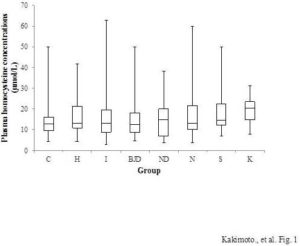
Figure 1: Plasma Hcy Concentrations of Each Canine Disease Group. C, Control (N=187); H, Heart Disease (N=143); I, Inflammatory Disease (N=71); BJD, Bone and Joint Disease (N=27); ND, Nervous System Disease (N=29); N, Neoplastic Disease (N=69); S, Skin Disease (N=16); and K, Kidney Disease (N=6). Boxes Indicate the First-Third Inter-Quartile Range; Horizontal Lines Indicate Median Values; Vertical Lines Indicate the Range
Acknowledgments
This research was supported in part by the Scholarship Program 2012 of the Japanese Society of Veterinary Clinical Nutrition. We thank Dr. N Miura (Kagoshima University), and the staff of the Kagoshima Small Animal Clinical Study Association for their support and advice.
References
Cacciapuoti, F. (2011). “Hyper-Homocysteinemia: A Novel Risk Factor or a Powerful Maker for Cardiovascular Disease? Pathogenetic and Therapeutical Uncertainties,” The Journal of Thrombosis and Thrombolysis, 32(1) 82-88.
Publisher – Google Scholar
Da Cunha, A. A., Ferreira, A. G. K. & Wyse, A. T. S. (2010). “Increased Inflammatory Markers in Brain and Blood of Rats Subjected to Acute Homocysteine Administration,” Metabolic Brain disease, 25(2)199-206.
Publisher – Google Scholar
Fokkema, M. R., Gilissen, M. F., Van Doormaal, J. J., Volmer, M., Kema, I. P. & Andmuskiet, F. A. (2003). “Fasting Vsnonfasting Plasma Homocysteine Concentrations for Diagnosis of Hyperhomocysteinemia,” Clinical Chemistry, 49 (5) 818-821.
Publisher – Google Scholar
Friedman, A. N., Bostom, A. G., Selhub, J., Levey, A. S. & Rosenberg, I. H. (2001). “The Kidney and Homocysteine Metabolism,” Journal of the American Society of Nephrology, 12 (10) 2181-2189.
Publisher – Google Scholar
Frosst, P., Blom, H. J., Milos, R., Goyette, P., Sheppard, C. A., Matthews, R. G., Boers, G. J., Den Heijer, M., Kluijtmans, L. A., Van Den Heuvel, L. P. et al. (1995). “A Candidate Genetic Risk Factor for Vascular Disease: A Common Mutation in Methylenetetrahydrofolate Reductase,” Nature Genetics, 10 (1) 111-113.
Publisher – Google Scholar
Fujiki, Y., Hirashima, Y., Seshimo, S., Okamoto, T., Sugimoto, Y., Matsumoto, M., Oka, T. & Andkanouchi, H. (2012). “Homocysteine Induced SH-SY5Y Apoptosis through Activation of NADPH Oxidase in U251MG Cells,” Neuroscience Research, 72 (1) 9-15.
Publisher – Google Scholar
Humphrey, L. L., Fu, R., Rogers, K., Freeman, M. & Andhelfand, M. (2008). “Homocysteine Level and Coronary Heart Disease Incidence: A Systematic Review and Meta-Analysis,” Mayo Clinic Proceedings, 83(11)1203-1212.
Publisher – Google Scholar
Husemoen, L. L., Toft, U., Fenger, M., Jørgensen, T., Johansen, N. & Andlinneberg, A. (2006). “The Association between Atopy and Factors Influencing Folate Metabolism: Is Low Folate Status Causally Related to the Development of Atopy?,” International Journal of Epidemiology, 35 (4) 954-961.
Publisher – Google Scholar
Lawrence De Koning, A. B., Werstuck, G. H., Zhou, J. & Austin, R. C. (2002). “Hyperhomocysteinemia and Its Role in the Development of Atherosclerosis,” Clinical Biochemistry, 36 (6) 431-441.
Publisher – Google Scholar
Lee, S. G. & Hyun, C. (2012). “Evaluation of Homocysteine Levels in Dogs with Chronic Mitral Valve Insufficiency,”Veterinary Record, 171 (9) 220.
Publisher – Google Scholar
Medina, M. A. & Andamores-Sánchez, M. I. (2000). “Genetic Basis of Hyperhomocysteinemia,” Molecular Genetics and Metabolism, 71 (3) 478-480.
Publisher – Google Scholar
Mijatovic, V., Kenemans, P., Jakobs, C., Van Baal, W. M., Peters-Muller, E. R. & Van Der Mooren, M. J. (1998). “A Randomized Controlled Study of the Effects of 17beta-Estradiol-Dydrogesterone on Plasma Homocysteine in Postmenopausal Women,” Obstetrics & Gynecology, 91 (3) 432-436.
Publisher – Google Scholar
Moustafa, A. A., Hewedi, D. H., Eissa, A. M., Myers, C. E. & Andsadek, H. A. (2012). “The Relationship between Associative Learning, Transfer Generalization, and Homocysteine Levels in Mild Cognitive Impairment,” PloS One,7(9)E46496.
Publisher – Google Scholar
Rasmussen, K., Møller, J., Lyngbak, M., Pedersen, A. M. & Anddybkjaer, L. (1996). “Age- and Gender-Specific Reference Intervals for Total Homocysteine and Methylmalonic Acid in Plasma before and after Vitamin Supplementation,” Clinical Chemistry, 42 (4) 630-636.
Publisher – Google Scholar
Rossi, S., Rossi, G., Giordano, A. & Andpaltrinieri, S. (2008). “Homocysteine Measurement by an Enzymatic Method and Potential Role of Homocysteine as a Biomarker in Dogs,” The Journal of Veterinary Diagnostic Investigation, 20 (5) 644-649.
Publisher – Google Scholar
Roubenoff, R., Dellaripa, P., Nadeau, M. R., Abad, L. W., Muldoon, B. A, Selhub, J. & Rosenberg, I. H. (1997). “Abnormal Homocysteine Metabolism in Rheumatoid Arthritis,” Arthritis & Rheumatology, 40 (4) 718-722.
Publisher – Google Scholar
Schroecksnadel, K., Frick, B., Wirleitner, B., Schennach, H. & Fuchs, D. (2003). “Homocysteine Accumulates in Supernatants of Stimulated Human Peripheral Blood Mononuclear Cells,” Clinical & Experimental Immunology, 134 (1) 53-56.
Publisher – Google Scholar
Trisolini, C., Minoia, G., Manca, R., Rizzo, A., Robbe, D., Valentini, L. & Andsciorsci, R. L. (2008). “Plasma Homocysteine Levels in Cycling, Pregnant, and Spayed Bitches,” Animal Reproduction Science, 108 (1-2) 29-36.
Publisher – Google Scholar