Introduction to the Perishable Goods world
The transport of perishable goods under refrigeration is relatively new in shipping history, and refrigeration was not popularized before the beginning of the Nineteenth Century, in spite of the fact that sea transport for goods is dated from over 5,000 years. Foodstuff transportation between regions was possible only in short distance and perishable goods were not even considered transportable. According to Waals (2010), “To bypass this problem, in 1879 the first ice-making machinery was installed onto a vessel, for the transport of chilled meat.”
It can be considered that the elements for a consistent refrigerated cargo trade development only came after World War II ending, as merchant ships could cross the Oceans and deep sea trades recover its frequent and regular basis; European countries were all under reconstruction and needed to be supplied (foodstuff inclusive); South American countries have had all production conditions to start a significant export trade of products like meat and fresh fruits.
Nowadays, according to the Brazilian Poultry Raising (União Brasileira de Avicultura – UBABEF)1 in 2010 Brazil has exported 5.7 millions of tons of meat, with 3.9 million referred to as poultry2. Also in 2010, Argentina has exported 395,000 tons of fresh fruit only from Patagonia area3, mainly apples and pears, confirming the importance of these two countries in the perishable trade.
This study aims to understand the characteristics and recent development of reefer cargo international sea transport in South American East Coast, including Brazilian, Argentinean, Uruguayan ports and also Paraguayan cargo loaded on transhipment operation. The paper is divided in three sections. The first one describes global reefer cargo transportation general characteristics, i.e., the system comprised by reefer container itself, goods packaging, plugging devices and facilities in port terminals and ships with proper equipment to carry reefer containers. The theory background is based upon the analysis of competitive and structural recent changes in the industry due to a concentration process. The second section reports recent development in five main market aspects: (1) Cargo flows; (2) Ports infrastructure; (3) Post-Panamax vessels operation and consequent economies of scale; (4) Shippers and carriers’ mergers and acquisitions processes and (5) Containerization process. Finally, third section analyses the relationship between shippers and shipping liners and the recent merging process impacts in the competitive environment.
Global reefer cargo transportation market
It is important to quote the technical definition of perishable cargo: “Article that can lose its usefulness and value if not appropriately stored or transported or if it not utilized within certain period”. (Business Dictionary, 2011) This paper focuses on perishable cargo, not only sensitive to time but also with a clear need of temperature controlling4.
Other settings may also be required like the humidity to prevent dehydration and ventilation to remove ethylene gas (and its effect on fruits’ ripening). The temperature control represents a determinant factor for successful refrigerated goods transportation, in a way that temperature control responsibility is a constant carriers and shipping lines concern as temperature diversions are one of the main reasons for cargo damages and claims (MMS, 2006). In this sense, specialists5 also say that product practical shelf life will be determined by three key factors: cargo preparation, preservation and packaging and the transit time and temperature composition. (Maersk, 2006)
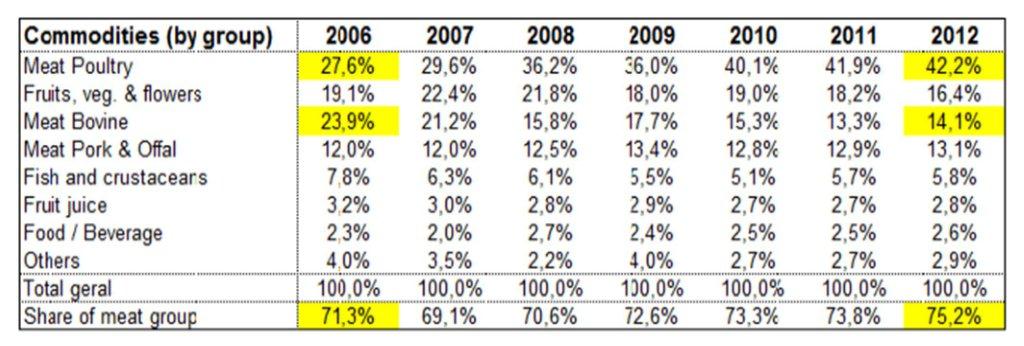
So far, there is no technology available to reverse goods’ deterioration caused by temperature effects. Hence the temperature control must be done all through the supply chain, from origin to destination. Any error or miss in temperature control during transportation could have consequences for the remaining cold chain links. This actually explains why perishable goods are almost a synonym of refrigerated cargo or just reefer cargo, as it is usually known in the industry. The paper is focused on foodstuff segment due to its major share in the South American East Coast trades, as further is demonstrated.
Reefer cargo transportation, despite its higher costs and risks (in comparison with general dry cargo), can be considered as a maritime container market worth niche with a remarkable development in the last years, following the several changes that occurred in the international logistics of perishable goods. In fact, shipping this kind of goods became cheaper and trustable and supermarkets and retailers can keep products’ range less seasonal, inducing new consumers’ habits of foodstuff.
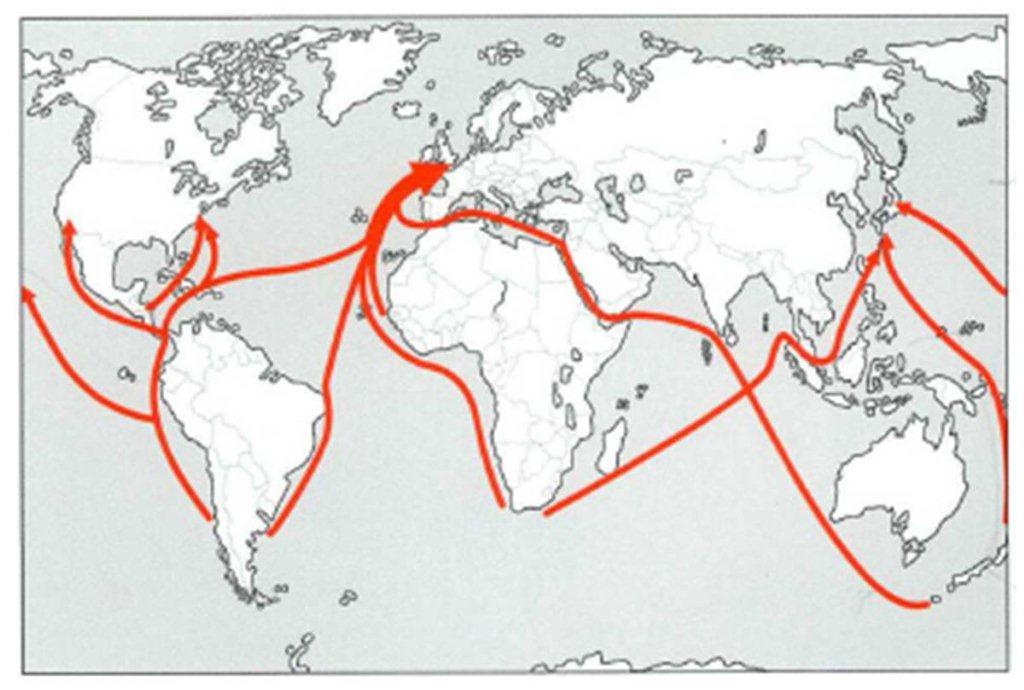
The historic background demonstrates that technological development could not only make shipping industry more diversified, but the market itself expanded. Figure 1 shows in a nutshell the main route directions of perishable goods: very much concentrated in the South-North trade.
Figure1: Perishable Food trade main routes
Source: De Haan (2005).
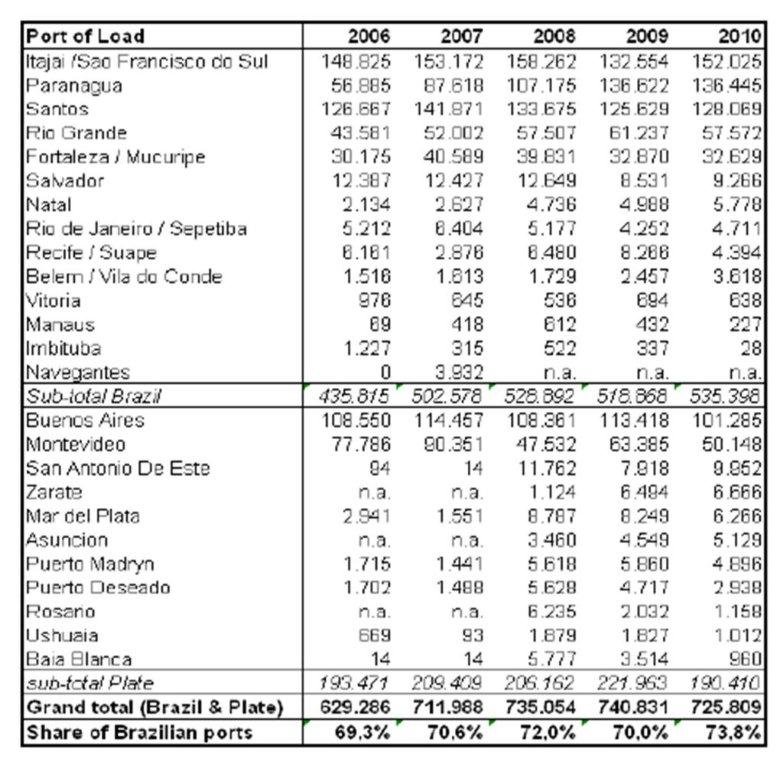
Remarks: n.a.: data not available
Source: Authors’ elaboration based on Dataliner/Centronave (2010)
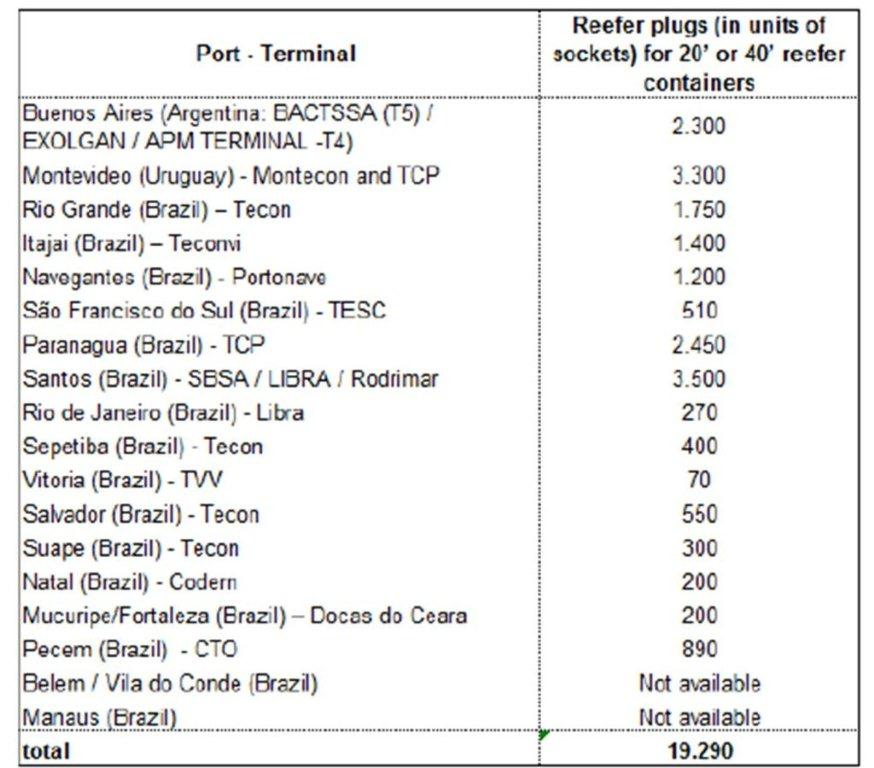
Table 8: South American East Coast main ports reefer plugs capacity
(in December 2010, not including pre-stacking hinterland area)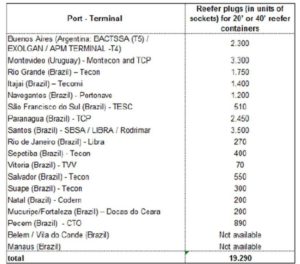
Source: Authors own elaboration based on Port terminal operators information
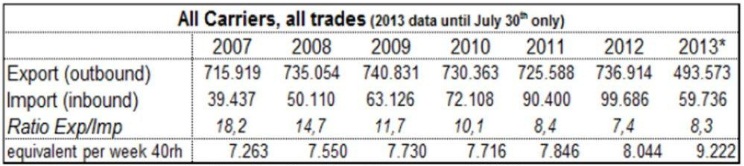
In general, ports and mainly terminal operators have improved their capacity and structure to meet reefer cargo in containers’ requirements. This is clear by crossing the information given on Table 4 and Table 8 (with the equivalent 40rh boxes per week reaching 9,222 in 2012 against a plug capacity of 19,290 in 2010). However, these ports’ problems affecting reefer cargo are not exclusively related to perishable products’ characteristics, but also to several bottlenecks linked to public ports’ policy reflected in accesses from land and by water (dredging still limited to geographical conditions) and terminals’ capacity (considering the fast international trade increase versus lead time to build and operate new port areas) improvement requirements.
Post-panamax vessels’ operation and respective economies of scale
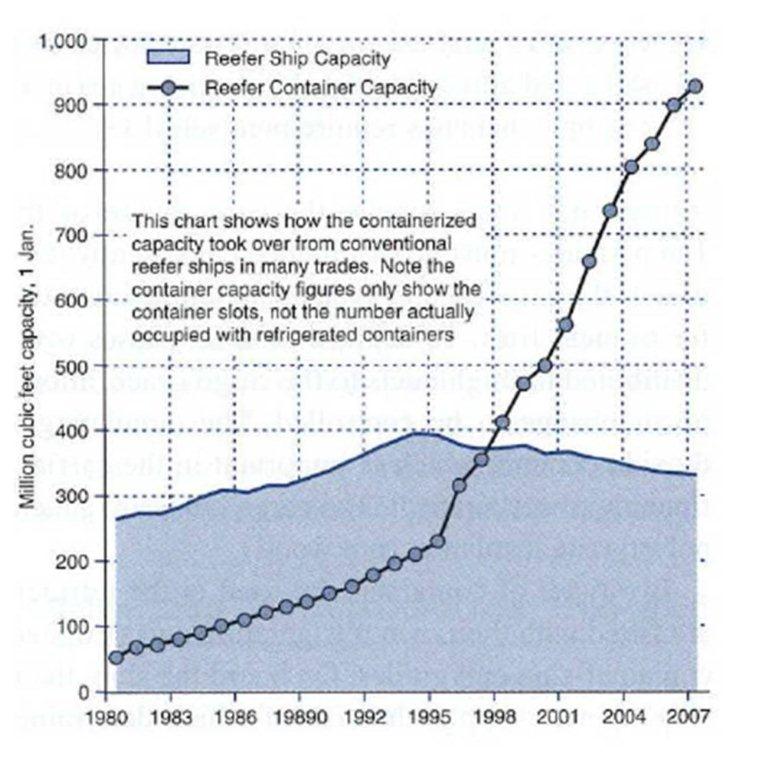
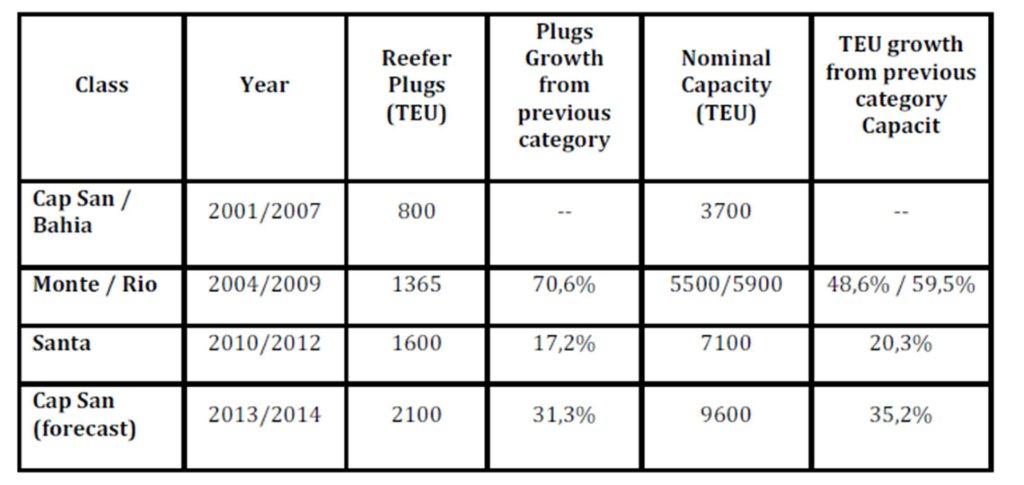
As mentioned before, carriers all over the world have increased the relation of reefer plugs per TEU in new bigger vessels, as a consequence of reefer cargo containerization. This is a global trend; as South America is one of the main reefer areas, the size of vessels calling the region has also increased. Figure 7 shows an interesting chart of ships capacities’ evolution over the last few decades presented by Hamburg Süd, one of the market leaders in the South American East Coast trades.
It is clear that carriers are looking for operational optimization and economies of scale provided by bigger ships, and take advantage of the profitability of reefer cargo share as part of the cargo mix. In this regard, Mr. Simon (Hamburg Süd Reefer department Director) interviewed, said:
“The shipping line of course benefits from economies of scale, as with larger capacity we need fewer ships for the same weekly services, but the reefer slot is an expensive investment for carriers, as the power consumption on board increases and also the risk exposure of transporting more perishable cargo on the same vessel.”
Table 9: Hamburg Süd capacity increase by vessels categories. Source: the Authors based on Costa (2011).
Nevertheless, these economies of scale have not being reflected as lower freight rate as stated by Veiga (Navitradeship owner) in an interview:
“In South America, I do not think that freight can reduce through the use of larger vessels with economies of scale. Here in Brazil, Argentina, and Uruguay and also in South American West Coast what really counts is the old law of supply and demand (for space).”
Potentially, rates’ cuts could be resulted from Freight Forwarders’ actions regarding their traditional consolidating volumes’ approach for bargaining volumes and prices. But, this also, as it was identified in the interviews, did not take place (until nowadays, at least). Freight Forwarder participation in reefer business is still low if compared with direct freight market by shippers (3.0% in 2010).
Shippers and carriers’ mergers and acquisitions processes
Another interesting phenomenon in South American reefer market is the remarkable concentration process both at shippers’ and carriers’ sides. Statistic data gathered demonstrate that at both sides shippers (demand) and carriers (supply) have consolidated their operation in several mergers’ and acquisition processes.
In the carriers’ side, two aspects are relevant: first, the increase in global container operators’ static capacity from 435,000 TEUs in 1980 to 12.9 million of TEUs in 2011, only considering the top 20 container operators worldwide. Second, the top 5 carriers increased concentration, from 44% in 1980 to 52% in 2011. Specifically in the case of reefer container carriers, one can notice that since 2006 the market has been very concentrated, as the top 5 carriers dominated more than 80% of reefer loadings12.
In the shippers’ side, the situation does not change much as the top five shippers went from a concentration of 28.5% in 2006 to 45.6% in 2010. There are many factors that could explain the increasing mergers’ and acquisition processes in Brazil, Argentina and Uruguay and they can be summarized in two typical situations: Small companies, normally owned by families, lost their scale to larger ones, which could practice more competitive prices (like what happened in the fresh fruit13 and frozen juice business14); or the companies that have suffered cash flows’ problems during the financial crises in 2008/2009 (like what happened very though to the bovine meat and poultry exporters)15 .
On this regard, Mr Simon said that:
“Yes, I believe this process is ended, at least slowed down and, on the contrary, there might be a trend of re-selling (splitting) these companies merged in the last 10 years, as the buyers prefer to have alternative suppliers instead of one or two very large companies (like in the poultry business). For carriers the impact was huge, as in the past we used to have 10 different shippers in certain market and we could decide the best combination for each shipper volume. Nowadays, we have three or four to make business. This represents a dependence increase for both sides: shippers and carriers. It is still unclear how positive this change could be.”
Aschenberger (former Maersk Sealand reefer manager) pointed in his interview:
“The market is dynamic. There will always be mergers and acquisitions. However, due to globalization and its increased competitiveness, there is a pressure for reducing costs to remain profitable. In this situation, the companies’ concentration results to be critical. With larger volumes in less exporting firms hands (due to concentration), it has been a great pressure for reducing freight costs.”
As early mentioned, the migration of cargo from traditional full reefer vessels to the reefer container is a global trend. According to Mr. Simon:
“There still a lot be containerized mainly in the Plate area (Argentina). Fruits (like apples and pear ex Patagonia 16 and Citrus at Up River17 areas) are still at 50/50 proportion. And there are also a lot of fish from Falkland Islands, which is still loaded in conventional reefer ships.”
The containerization process certainly requires a more detailed investigation which is not the case here, but it is important to consider as phenomena still taking place in the South American east coast trades.
Conclusions
This paper’s first important conclusion is that reefer cargo has several trades, flows and transportation requirements, which characterise it as a very specific market niche operated by specialists. The risk of transporting reefer goods is much larger than the general cargo, and therefore shipping liners involved have to be more dedicated and specialized, resulting in a more concentrated market.
As it was previously quoted, oligopoly market operation could be summarized as follows: (1) Reduced number of players; (2) clear barriers of entry; (3) low probability of substitutive services/products in the short term and (4) uncertain and interdependence among agents regarding their pricing policies.
As, especially in Brazil, the containerization process is coming to its end, carriers’ efforts are concentrated in their strategic share in the reefer container business. As it was demonstrated, South American reefer market has passed by an important concentration process, leading carriers and shippers to different and more balanced bargain power in their operations.
It is possible to preview that South American perishable goods’ trade will keep growing in the coming years, especially considering that Brazil has still a lot to grow in as global player in the foodstuff market18, and Argentina has still a significant volume of reefer cargo to containerize in Patagonia and Up River areas. On the other hand, it would be skittish just to say that it will happen in three or five years, as perishable trade market depends very much on economic factors affecting foodstuff international trade and on local infrastructure to support export trade volumes.
This paper aimed to analyze this important niche in maritime freight market, focusing on reefer traffic in the South American East Coast. It was possible to conclude that the industry, both sides (shippers and carriers) showed relevant and recent concentration processes. Therefore, from an academic point of view it has accomplished its explanatory purpose on reefer market at the South American East Coast, but is far from exhausting research possibilities in this specialized and demanding niche market.
Acknowledgements
The authors are grateful to business experts Henrik Simon, Roberto Aschenberger, Americo Veiga, Santiago Rigby, Rogerio Meneghetti for their prompt assistance and cooperation in gathering information and market expertise support for the paper development.
Notes:
1.Refers to statistic data available on ABEF (2012).
2.Additional information on poultry exports volumes: In 2011, according to Dataliner/Centronave, Brazil Foods has exported 90,000 FEUS, which represents an average of almost 2,000 FEUS per week for more than 130 different countries.
3.Southern region of Argentina. Statistic data retrieved from Patagonia Norte (2011).
4.The cooling down a product main purpose is to avoid four kind of deterioration: First, external physical deterioration which can start by other factors (like inadequate packaging), but worsen, oscillation of temperature. Second, physiological deterioration, which is defined as damage in product functionalities (like mangoes under too low temperature and are injured by chill). Third, chemical deterioration caused by product substances reaction or other used for its conservation. Fourth, the pathological deterioration caused by diseases organisms (fungi and bacteria) that can more easily develop at higher temperatures. (MMS, 2006)
5.Typical reefer cargo claims on the carrier are: 1. Temperature deviations (high carriage temperature; chilling; freezing). 2. Humidity and atmosphere management. 3. Service: delay on transit time. 4. Reefer bad functioning. 5. Poor container hygiene, poor container condition (structure). 6. Others: pre-shipment conditions: post harvest, pre-cooling, packaging, stowage (air circulation). MMS – Marine Management Surveyors UK (2006):
6.Levinson (2006) describes containers usage by the US Army and Navy during 1960s and 1970s.
7.A liner service can be defined as a regular service with fixed schedules and pre announced transit times between call ports. (Malchow and Schultze, 1993)
8.Guerise (2006) supported by Ballou (1993); Bowersox et al. (2002); Robles (2001).
9.Typical suppliers, local companies such as: terminal operators; stevedores; tug boat companies and reefer cold stores.
10.An alternative taken by carriers to reduce this imbalance is reefer containers offer to importers as dry box moving as “NOR” (non-operating reefer). But this is not count as part of reefer import trade.
11.Exception in this case are Rio Grande at Rio Grande do Sul (Brazilian Southern Region), Pecem that is 60 km away from Fortaleza (Brazil) and Suape that is 50 km away from Recife (Brazilian Northeastern Region).
12.For a detailed analysis about mergers and acquisitions, see Galvão (2009a, 2009b)
13.Univeg group is one example, as they have purchased over 20 different farms.
14.Citrovita purchase by Votorantin Group is another good example.
15.The cases of Sadia taking over by Perdigão (lately named as Brazil Foods) and the Frigorifico Bertin taken by JBS/Friboi group are also illustrative cases.
16.Cargo loaded in Baia Blanca and San Antonio de Este in Argentina.
17.Cargo loaded in Zarate Port in Argentina.
18.For example, Brazil is not participating in the fresh banana trades, one of the international reefer business main commodities.
(adsbygoogle = window.adsbygoogle || []).push({});
References
1.ABEF. [On line], [Retrieved January 15, 2012], http://www.abef.com.br/ubabef/exibenoticiaubabef.php?notcodigo=2761.
2.Ballou, R.H. (1993), Logística Empresarial: Transportes, Administração de Materiais e Distribuição Física, Atlas, São Paulo.
3.Bowersox, D.J., Closs, D.J., & Cooper, M.B. (2002). Supply Chain Logistics Management, McGraw Hill Higher Education, New York.
4.Business Dictionary. (2011). [On line], [Retrieved March 3, 2011], http://www.businessdictionary.com/
5.Dataliner, Centronave Data Bank. (2012/2011/2010). [On line], [Retrieved Februrary 7, 2012], http://www.datamar.com.br/DataLiner.aspx 2012
6.Costa, G. (2011), ‘Modalidades de Transporte na Movimentação de Contêineres’, Conference at 8th Seminário Internacional em Logística Agroindustrial on April 18, 2011 in ESALQ-LOG, Piracicaba (SP), [On line], [Retrieved April 20, 2011], http://log.esalq.usp.br/home/pt/seminario.php?sh=2011_2
7.De Haan, H. (2005), De Beer’s consolidated manual on the transportation of perishable cargo in reefer containers, BTM De Beer b.v., Rotterdam.
Publisher – Google Scholar
8.Drewry (2010), Reefer Shipping Market 2010/11, Drewry Shipping Consultants, London.
9.Dynamar (2010). Reefer Analysis: Market Structure Conventional Containers. Dynamar Bv., September, 2010.
10.Galvão, C. B. (2009a), Os portos marítimos na mundialização do capital. MSc. Thesis in Economics, Pontifícia Universidade Católica de São Paulo (PUC/SP).
11. ________. (2009b). Fusões e Aquisições: uma outra forma com a mesma essência. In: Marques, R.M. O Brasil sob Nova Ordem. São Paulo: Saraiva.
12.Guerise, L. C. (2006). Aplicação dos conceitos de logística integrada na exportação de açúcar e suco de laranja pelo Porto de Santos. 148p. MSc thesis in Business Management, Universidade Católica de Santos, Santos-SP.
13.Maersk Line (2006), The Reefer Seminar on South America Reefer Operations department, São Paulo.
14.Malchow, G. and Schultze, D. (1993), Güterverkehr über See. Lüneburg: Stern-Verlag KG.
15.MMS (2006), Marine Management Surveys. Reefer Seminar. São Paulo.
16.Patagonia Norte (2011), Estadística de Embarque. [On line], [Retrieved March 23, 2012], http://www.patagonia-norte.com.ar/estadisticas.htm.
17.Robles, L.T. (2001), A prestação de serviços de logística integrada na indústria automotiva no Brasil: em busca de alianças estratégicas logísticas, PhD Thesis in Business Administration, Faculdade de Economia, Administração e Contabilidade da Universidade de São Paulo, FEA-USP, São Paulo.
18.Stopford, M. (2009), Maritime Economics, Routledge, Taylor & Francis Group, 3rd Ed., New York.
Google Scholar
19.UN. (2011), United Nations, World Basic Data, [On line], [Retrieved March 20, 2011], http://www.un.org/esa/population
20.Waals, F. (2010), Dynamar 2010, Reefer Analysis – Market Structure, Conventional, Containers. Alkmaar: Dynamar B.V.