Effect of Serum Uric Acid in Augmentation of Insulin Secretion and Improvement of HbA1c in Diabetic Patients: Proposed Statistical Regression Models for Uric Acid, HbA1c and Insulin
Diabetology Clinic, Aseer Diabetes Center, Aseer Central Hospital, Ministry of Health, Abha, Saudi Arabia
Volume 2014 (2014),
Article ID 237887,
Journal of Research in Diabetes,
14 pages,
DOI: 10.5171/2014.237887
Received date: 1 October 2013; Accepted date: 17 December 2013; Published date: 26 February 2014
Academic Editor: Harald Mangge
Cite this Article as:
Kamran M. A. Aziz (2014), "Effect of Serum Uric Acid in Augmentation of Insulin Secretion and Improvement of HbA1c in Diabetic Patients: Proposed Statistical Regression Models for Uric Acid, HbA1c and Insulin," Journal of Research in Diabetes, Vol. 2014 (2014), Article ID 237887, DOI: 10.5171/2014.237887
Currently serum uric acid is not considered a metabolic biomarker in diabetes. The purpose of the current study was to find the significant associations, correlations and to develop regression models between uric acid, HbA1c, and serum insulin among diabetic patients. The study enrolled type-1 and type-2 diabetic patients for 30 months. For HbA1c and uric acid, patients were divided into two groups: HbA1c <7% or HbA1c ≥7%, UA < 6.5 mg/dl or UA ≥ 6.5mg/dl, respectively. For measurement of insulin levels, patients on diet/metformin only were selected. Data for 1205 patients were analyzed which included 754 (62.6%) males, 451 (37.4%) females, 92 (7.6%) type-1, and 1113 (92.4%) type-2diabetic subjects. For the group HbA1c < 7%, uric acid levels were higher (mean 5.8±4.7) as compared to HbA1c > 7% (mean 4.8±1.5); for the group UA < 6.5 mg/dl, serum insulin levels were lower (mean 39±15.7) as compared to the group with UA≥ 6.5 mg/dl (mean 73.4±20.5). Uric acid was significantly and inversely correlated with HbA1c (r = – 0.13, p-value < 0.0001) and positively correlated with serum insulin (r = 0.293, p-value = 0.005). Regression models for uric acid and HbA1c was found to be HbA1c = 10.235 + (-0.094 × uric acid); p-value < 0.000 and for uric acid with insulin was observed to be Serum insulin = -9.650 + (11.595 × uric acid); p-value 0.005. Higher levels of uric acid are associated with lower HbA1c both in type-1 and type-2 diabetic patients. Uric acid is involved in the augmentation of insulin secretion in type-2 subjects.
Currently, diabetes is considered a major health problem with increasing prevalence, and leading cause of morbidity, mortality and vast complications (King et al. 1998; Chen et al. 2002; Sheetz and King 2002; Mathers and Loncar 2006). Landmark and historical research trials have shown a positive association between impaired glycemic control (hyperglycemia) and the risk of CHD (coronary heart disease) and other diabetes complications such as nephropathy (Nathan et al. 1995; Wei et al. 1998; Turner et al. 1998). Hence, controlling hyperglycemia is important to reduce complications. Long term diabetes control status is assessed by HbA1c (glycosylated hemoglobin) (Santigo et al. 1978; Caglier et al. 1999). For monitoring diabetes, HbA1c is now a standard methodology in diabetology clinics, which measures patient’s glycemic control for the past 2-3 months (Little et al. 2001; Berg et al. 2008). Regarding human metabolism, uric acid [UA; 7, 9-dihydro-1H-purine-2,6,8(3H)-trione] is the final breakdown product of purine degradation in humans, which is a weak acid distributed throughout the extracellular fluid as sodium urate and ultimately excreted in urine. The amount of urate in the blood depends on the dietary intake of purines, urate biosynthesis, and the rate of urate excretion. (Van et al. 2006). Emerging data suggest that uric acid is implicated as a risk factor and cause of numerous disease states such as gout, hypertension, type-2 diabetes, cardiovascular and renal disease (Fang and Alderman 2000; Kang et al. 2002; Nakanishi et al. 2003; Alper et al. 2005; Bos et al. 2006; Johnson et al. 2009).
The metabolic syndrome (syndrome X or insulin resistance syndrome) consists of a group of metabolic abnormalities that increase the risk of cardiovascular disease (CVD) and diabetes mellitus (DM).Under normal physiological conditions, insulin actively reduces the renal clearance of both sodium and uric acid. These actions are also preserved during the states of insulin—resistance such as obesity, diabetes and essential hypertension, and hence are the cause of clustering hyperinsulinemia (X-syndrome), hyperuricemia and hypertension (Quinones et al. 1988a; Fachini et al. 1991; Vuorinen et al.1994; Quinones et al. 1995b; Reaven et al. 1998; Niskanen et al.2006;) . This phenomenon indicates that metabolic syndrome comprises a group of abnormalities including high uric acid. Hyperuricemia is defined as a plasma (or serum) urate concentration >405 μmol/L (6.8 mg/dL). Currently, uric acid is still not considered a potential biochemical marker and target while managing diabetes.
Insulin is a peptide hormone with a molecular weight of approximately 6000 Daltons. It is secreted by β-cells of the pancreatic islets of Langerhans and is generally released in pulses, with the parallel glucose cycle normally about 2 minutes ahead of the insulin cycle (Lang et al. 1979). Normal insulin secretion at basal and prandial (meal related) occasions controls hyperglycemia and improves glycemic control. Furthermore, exact association between serum uric acid levels and diabetes mellitus, hyperglycemia, hyperinsulinemia is still not clear. There are some studies which have reported a positive association between high serum uric acid and the development of type-2 diabetes (Modan et al. 1987; Perry et al. 1995; Dehghan et al. 2008; Chien et al. 2008; Kramer et al. 2009; Kodama et. al. 2009), other studies claim no association (Taniguchi et at. 2001), whereas some research trials have proved an inverse relationship (Nan et al 2007; Oda et al. 2009). However most of these studies have selected the pre-diabetic patients to observe the association and risk for developing type-2 diabetes and its prevalence, while others have measure common correlations and no study could be found in this capacity for type-1 diabetic patients. In addition to these controversial phenomena, a study conducted on beta cell function with HOMA, among subjects with hyperuricemia, has reported failure of beta cells to compensate for the variation in insulin sensitivity and lack of insulin action (Simental-Mendia et al. 2009). Hence, it can be observed that there are studies on different populations which have established strong association between serum uric acid as a risk factor and the development of type-2 diabetes while others have reached to an opposite conclusion for association of uric acid with improved insulin secretion.
Similarly there are no studies so far which have measured significant association with regression models for HbA1c and serum uric acid among diabetic subjects, which is essential to estimate. Similarly, statistical regression models are lacking for serum uric acid and fasting serum insulin levels to estimate insulin secretion from β-cell of pancreas for type-2 diabetics.
Under this scientific background, the purpose of the current study was to measure the significant association, correlation (positive or negative) and to develop a regression model between HbA1c levels (glycemic control) and serum uric acid among diabetic patients. Also, it was the aim to measure the correlation of serum insulin with uric acid, which so far has not been studied. In other words, the aim of this study by such methodology was to develop a statistical model by which HbA1c or diabetes control (for type-1 and type-2 diabetics) and insulin secretion by β-cells (in type-2 diabetics) can be estimated.
Materials and Methods
The current study is a prospective and cross sectional analytical study which has enrolled the diabetic patients who were on routine follow up in diabetology clinic.
Aseer Diabetes Center of Aseer Central Hospital is one of the largest tertiary care diabetes centers for the Ministry of Health in Aseer Region, equipped with all modern facilities. Diabetic patients from Aseer province are referred to Aseer Diabetes Center for evaluations and follow up. The study included type-1 and type-2 diabetic patients. Children (age <13 years) and pregnant diabetic subjects were excluded from the study. Similarly, patients on end stage renal disease (ESRD) or on dialysis and with active hepatic disease were again excluded from the study. Data for known diabetic patients (type-1 and type-2) were collected in the diabetology clinic from December 2011 till May 2013, a total duration of 30 months (2.5 years).
Considering the hyperglycemia, a cut off value of 7% was selected and all the patients were divided into two groups for HbA1c levels, HbA1c <7% or HbA1c≥7%. Similarly, two groups were synthesized for uric acid levels, UA < 6.5mg/dl or UA ≥ 6.5mg/dl.
Furthermore, for the analysis of data for uric acid and HbA1c, all diabetic patients of the study (both type-1 and type-2) were included. However, for the analysis of data for uric acid and fasting serum insulin levels, patients on diet control or only on metformin therapy were selected; all those patients who were managed on insulin secreting therapy i.e., sulfonylureas/oral hypoglycemic agents (SU/OHAs) or those on any type of insulin injections therapy, including type-1 diabetics, were excluded from this analysis. This methodology was applied to exclude insulin secretary effect by medications (OHAs, insulin), to assess only endogenous insulin secretion, and to analyze levels of insulin with that of uric acid. Hence regarding the management, there were two groups of patients, those on diet/metformin and others on OHA/insulin therapy.
Laboratory Samples Collection, and Data Retrieval
All laboratory measurements and data were collected at follow up visits in fasting state and by standardized methodology. Interested variables (HbA1c, serum uric acid, and fasting insulin) were selected for the analysis and study. Samples were sent to Aseer Central Hospital main laboratory for biochemical analysis. HbA1c was measured by A1c Flex® Reagent by the Dimension® clinical chemistry system, an in vitro diagnostic assay for the quantitative determination of both percent hemoglobin A1c and total hemoglobin, based on a turbidimetric inhibition immunoassay (TINIA) principle, and the measurement of total hemoglobin is based on a modification of the alkaline hematin reaction, an NGSP certified methodology (Siemens healthcare diagnostics Inc. Newark, DE 19714, U.S.A). The percentage of total hemoglobin that is glycated was calculated and reported as %HbA1c (in g/dL), and the final result has been standardized to the results obtained in DCCT (Chang et al. 1998; Metus et al 1999).
Uric acid was measured by URCA method used on Dimension® clinical chemistry system, an in vitro diagnostic intended for the quantitative determination of uric acid in human serum and plasma (Siemens healthcare diagnostics Inc. Newark, DE 19714, U.S.A). The uric acid method is a modification of the uricase method first reported by Bilger and Johns (later modified by Kalckar) (Slaunwhite et al. 1975; Pachla and Kissinger 1975). Uric acid, which absorbs light at 293 nm is converted by uricase to allantoin, which is non-absorbing at 293 nm. The change in absorbance at 293 nm due to the disappearance of uric acid is directly proportional to the concentration of uric acid in the sample and is measured using a bichromatic (293, 700 nm) endpoint technique.
Serum insulin was measured by electrochemiluminescence immunoassay (ECLIA) technique using insulin kit on Cobas® e 411 immunoassay analyzer, an in vitro diagnostic test for quantitative determination of human insulin (Roche Diagnostics GmbH, Mannheim, Germany) (Marcovina et al. 2007)
All sample requests were entered and retrieved by centralized and computerized Natcom Hospital Information System (NATCOM HIS; National Computer System Co. Ltd), a server based hospital management system interconnecting all departments of Aseer Central Hospital and its diabetes center.
Statistical Methods
Variables of interest were entered and all data analyzed using SPSS® version 14 for Windows (SPSS®Inc, USA). All statistical tests were performed by standardized methodology in accordance with the reference to statistical research literature review (Norman et al. 1994; Kleinbaum et al. 1998; Simpson and Berry 1998; Sawilowsky et al. 2002). For conducting statistical tests and analysis, it was assured that all assumptions were met, such that outcome variable (HbA1c, fasting serum insulin) and other variables were normally distributed (requiring no data transformation) while observing the skewness and kurtosis values between -1 and +1 with no influential outliers. For HbA1c and uric acid correlation and regression model building, again all statistical assumptions were satisfied, while using Pearson’s correlation coefficient (r), that variables have linear relationship. Regression model was used to measure the extent to which serum uric acid can predict HbA1c (diabetes control) and insulin secretion as well. To observe the possible effects and interactions of confounders, such as body mass index and serum lipids (total cholesterol, triglycerides and LDL-C), univariate ANCOVA was additionally performed, after fulfilling the statistical assumptions and criteria for ANCOVA.
This study was designed to have a statistical power of 90% to detect significant changes. All p-values were two sided, and p-values less than 0.05 were considered statistically significant.
Results
Data for 1205 patients were analyzed to obtain the significant results. There were 754 (62.6%) males and 451 (37.4%) females in the study with 92 (7.6%) type-1 and 1113 (92.4%) type-2 subjects. 496 (41%) demonstrated HbA1c <7% while 709 (59%) with HbA1c ≥7%. Similarly, 784 (65%) had uric acid UA < 6.5 mg/dl while 421 (35%) subjects showed UA ≥ 6.5 mg/dl. 1032 (85.7%) patients were using different OHA/insulins while 173 (14.3 %) were on diet control or metformin only. Detailed demographic characteristics are presented in Table-1.
Table 1: Demographic Data of Diabetic Patients
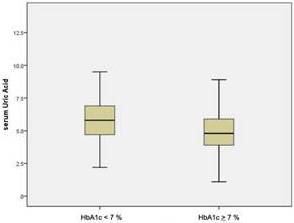
Table-2 shows data for variables of age, diabetes duration, HbA1c, uric acid, and serum insulin levels, BMI, total cholesterol, triglycerides, and LDL-Cholesterol with mean±SD (95% CI). Table-3 shows data for grouped variables of HbA1c (<7% and ≥7%), uric acid (<6.5mg/dl and ≥6.5mg/dl) with Mean ± SD (95%CI). According to the data produced by SPSS, it was observed that for the patients of the group HbA1c < 7%, uric acid levels were higher with mean 5.8±4.7 (95%CI 5.24 to 6.35) as compared to those with HbA1c ≥ 7% where uric acid was at lower level with mean 4.8±1.5 (95% CI 4.72 to 4.99). Similarly, it was also observed that for the group UA < 6.5 mg/dl, serum insulin levels were lower with mean 39±15.7 (95% CI 27.5 to 50.7) as compared to the group with UA ≥ 6.5 mg/dl with mean 73.4 ± 20.5 (95% CI 46 to 100.6). Additionally, it was also found that for HbA1c < 7% serum insulin levels were higher with mean 47.8 ± 21.3(95% CI 26 to 69.4) as compared to those with HbA1c ≥ 7% where mean was 42.56 ± 18.4 (95% CI 22.8 to 34.2).This data is presented in table-3 and graphically presented by box plots in figure 1 and figure-2.
Table 2: Variables with Mean ± SD (95% CI)
Table 3: Grouped Variables (Uric Acid, HbA1c, and Fasting Insulin Levels) with Mean ± SD (95%CI)
Figure 1. Box Plot for Serum Uric Acid Levels with HbA1c
Figure 2. Box Plot for Serum Insulin Levels with Uric Acid
Regarding ANCOVA, it was observed during statistical analysis that no linear relationship existed between the outcome variables (serum insulin and uric acid). Hence by this methodology, possible interactions of confounders (BMI, total cholesterol, triglycerides, LDL-C) were ruled out and further analysis was performed thereafter.
Similarly, possible effect of gender on fasting serum insulin levels was ruled out by performing statistical t-test which demonstrated non-significant differences (p-value = 0.849).
Table -4 and table-5 respectively show the significant correlations and students’ t-test for the variables selected. According to this, uric acid was significantly and inversely correlated and associated with HbA1c (r =- 0.13, p-value < 0.0001; t-test p-value = 0.007). Uric acid was also significantly positively correlated and associated with serum insulin levels (r = 0.293, p-value = 0.005; t-test p-value < 0.0001). Although this is not the objective of the study, it was observed that HbA1c was significantly and inversely correlated and associated with serum insulin levels (r = – 0.230, p-value < 0.05; t-test p-value < 0.0001).
Spearman’s Cause effect relation between fasting serum insulin and uric acid (UA> 6.5 mg/dl and UA>6.5 mg/dl) is shown in table-6 with p—value 0.007 which demonstrates that there is a strong cause effect relationship between the two variables.
Table 6: Spearman’s Cause Effect Relation between Serum Insulin Levels and Uric Acid
Predictive regression models are shown in table-7 with Beta (β), R, R², and adjusted R². For the regression models of serum uric acid and HbA1c, p-value was significant at the level of < 0.0001 with following regression equation in the form of y = a + bx:
HbA1c = 10.235 + (-0.094 × uric acid)
Similarly, for the regression models of serum uric acid and fasting serum insulin levels, p-value was significant at the level of 0.005 with the following regression equation in the form of y = a + bx:
Serum insulin = -9.650 + (11.595 × uric acid)
These significant regression models with linear curve estimation are presented in figure 3 and 4 respectively.
Table 7: Regression Models for Uric Acid, HbA1c and Serum Insulin Levels
Discussion
In the usual general medical and diabetes management practice, serum uric acid is usually overlooked as a potential marker of diabetic metabolic status and insulin secretion estimation. In the medical literature, there are some studies which have proved a positive association between serum uric acid and development of type-2 diabetes and syndrome-X ((Lang et al. 1979; Quinones et al. 1988a; Fachini et al. 1991; Vuorinen et al.1994; Quinones et al. 1995b; Perry et al. 1995; Reaven et al. 1998; Niskanen et al.2006). However, these studies either did not include diagnosed diabetic patients or did not develop statistical models to predict diabetes control status i.e., HbA1c. Moreover and conversely, it is also interesting to note that some of these studies have documented hyperinsulinemia with increasing serum uric acid levels among subjects without diabetes (Chou et al. 2001). These data can be interpreted such that uric acid might augment insulin secretion. Furthermore, hyperuricemia has been implicated as a strong causative factor for the development of insulin resistance indicating its involvement in hyperinsulinemia and independent risk factor for future development of type-2 diabetes mellitus (Vuorinen-Markkola et al. 1994). However, its association was also found to be negatively associated with diabetes (Nan et al 2007; Oda et al. 2009). It has been documented in research trials that hyperglycemia per se may lead to increased urinary excretion of uric acid (Herman et al. 1982). Similarly, it has been shown that hyperinsulinemia due to insulin resistance causes an anti-uricosuric effect on the renal system leading to high levels of uric acid in serum or plasma (Whitehead et al. 1992; Mount et al. 2006; Adlija et al. 2010). Under these observations including hyperglycemia, HbA1c levels should be high (hyperglycemia leading to hyperinsulinemia or IR and ultimately high HbA1c) and as well as those of serum uric acid, which was not the case in our study. Current study observations were opposite to the hypothesis of positive association of uric acid with impaired glucose control, where we found a negative and inverse relationship between serum uric acid and HbA1c among diabetic patients. Hence, in the present study uric acid was found to be a potential biomarker of the glucose metabolism.
Additionally, the role of elevated serum uric acid in augmentation or suppression of insulin secretion still remains obscure. Some investigators have reported the involvement of uric acid in impaired or decreased insulin secretion (Scott et al. 1981; Ročić et al. 2005; Jia et al. 2006; Weghuber et al. 2013; Mangge et al. 2013), suggesting that uric acid might inhibit insulin secretion. All this research evidence requires further studies to investigate the role of uric acid in augmentation of insulin secretion in details.
It was also the aim of the current study to investigate how serum uric acid concentration affects and correlates with that of fasting insulin in diabetic patients. Our observations were not different from the previous research trials which have reported increased insulin secretion by uric acid (Worlicek et al. 1981; Sinagra et al. 1996). However, there were no studies which have synthesized the regression model for uric acid and insulin levels, neither estimated insulin secretory effect by uric acid; this goal was achieved in the current study. Hence, the current study findings with regression models proved that uric acid augments insulin secretion. For example, according to the observed regression equation, if uric acid level of 5 mg/dl is considered then insulin secretion/level would be about 48.3 μU/mL. Similarly, if uric acid is found to be 10 mg/dl, then insulin levels would be about 106.35 μU/mL, approximately more than 2-fold than the previous value. By this regression equation methodology, insulin secretion and levels can be easily determined by diabetologist or physician in routine clinical practice for type-2 DM patients.
This phenomenon can be utilized among type-2 diabetic patients for the assessment of insulin secretion by beta-cell and at the same time for the dosage adjustments of OHA/insulins for those patients who have a history of hypoglycemia with sulfonylureas or insulin injections.
Furthermore, UA has been also known in the research literature as antioxidant (Ames et al. 1981; Bowman et al. 2010). This antioxidant property might preserve or delay apoptosis and improve the β-cell function in diabetics and augment the insulin secretion, a phenomenon which has been observed in the current study. However, further studies are required for the role of uric acid as antioxidant in diabetes state.
Although these are not the objectives of the study, statistically it was found that HbA1c levels were negatively and significantly correlated with insulin levels indicating improvements of diabetes control with augmentation of insulin secretion by uric acid in the same sample of diabetic subjects and data sets. However, the fact of inverse relationship between uric acid and HbA1c among type-1 DM subjects remains unclear as there is total destruction of β-cells. Further studies are required to investigate this phenomenon. But for type-2 DM subjects, elevated uric acid levels cause augmentation of insulin secretion which in turn improves glycemic control and cause reduction in HbA1c levels, a phenomenon of inverse relation between uric acid and HbA1c.
These pieces of evidence suggest that uric acid might have an important role in the determination of the beta cell function in patients with type-2 diabetes, augmentation of insulin secretion and improvement of glycemic control both in type-1 and type-2 diabetic patients. Uric acid should be measured in diabetology clinics while requesting baseline investigations, and proposed regression model can be utilized for the assessment of insulin secretion, β-cell function in type-2 diabetic patient and consequent management accordingly. Further studies are required to investigate in depth the role of uric acid for the improvement or augmentation of insulin secretion in type-2 diabetic subjects and glycemic control status both in type-1 and type-2 diabetic patients.
Conclusion
Uric acid is a potential metabolic biomarker of insulin secretion and glycemic control. While requesting baseline investigations in diabetology clinics, uric acid should also be requested to assess the level of insulin secretion. Proposed regression models can be used as a guide to estimate insulin secretion and β-cell function in type-2 diabetic patients. Further studies at molecular and hyperinsulinemic-euglycemic clamp level are required to investigate and quantify in depth the role of uric acid in augmentation of insulin secretion and insulin resistance.
References
Adlija, C., Sabina, S., Amra, M. D., Bakira, C., Tanza, D., Maja, M. & Tamer, B. (2010). ‘Relevance of Uric Acid in Progression of Diabetes Mellitus,’ Journal of Basic Science. 2010; 10(1): 54-59. Google Scholar
Chen, X., Tank, L., Tan, A., Zhao, L. & Hu, C. (2005). ‘Economic Burden and the Impact of Complications of Type 2 Diabetes Mellitus in Urban China,’ 2005.
Mathers, C. D. & Loncar, D. (2006). ‘Projections of Mortality and Burden of Disease to 2030,’ World Health Organization, Burden of Disease Project. 2006.
NATCOM Hospital Information System (NATCOM HIS), National Computer System Co, Ltd. http://natcom.com.sa/healthcare and http://natcom.com.sa/clients (Accessed on: November 17, 2010).
Simpson, J. & Berry, G. (1998). ‘Simple Regression and Correlation,’ In: Handbook of Public Health Methods, Kerr C, Taylor R, Heard G (editors). Roseville, Australia: McGraw-Hill Companies Inc, 1998: pp 288—295.
van Gennip, A. H., Bierau, J. & Nyhan, W. L. (2006). “Inborn Error of Purine and Pyrimidine Metabolism,” In: Blau N, Hofman G, Leonard J (eds.) Physician’s Guide to the Treatment and Follow-up of Metabolic Diseases. Heidelberg: Springer-Verlag, 2006. pp. 245—55. Publisher – Google Scholar